I’ve seen this setup play out too many times to ignore.
$SHR has been compressing inside a massive descending triangle for months, with sellers repeatedly failing to break the same support.
Volatility is drying up. Price is approaching the apex.
One strong breakout could completely change the structure.
Keeping a close eye on this one.
#Kucoin
$OBI did exactly what the chart said it would.
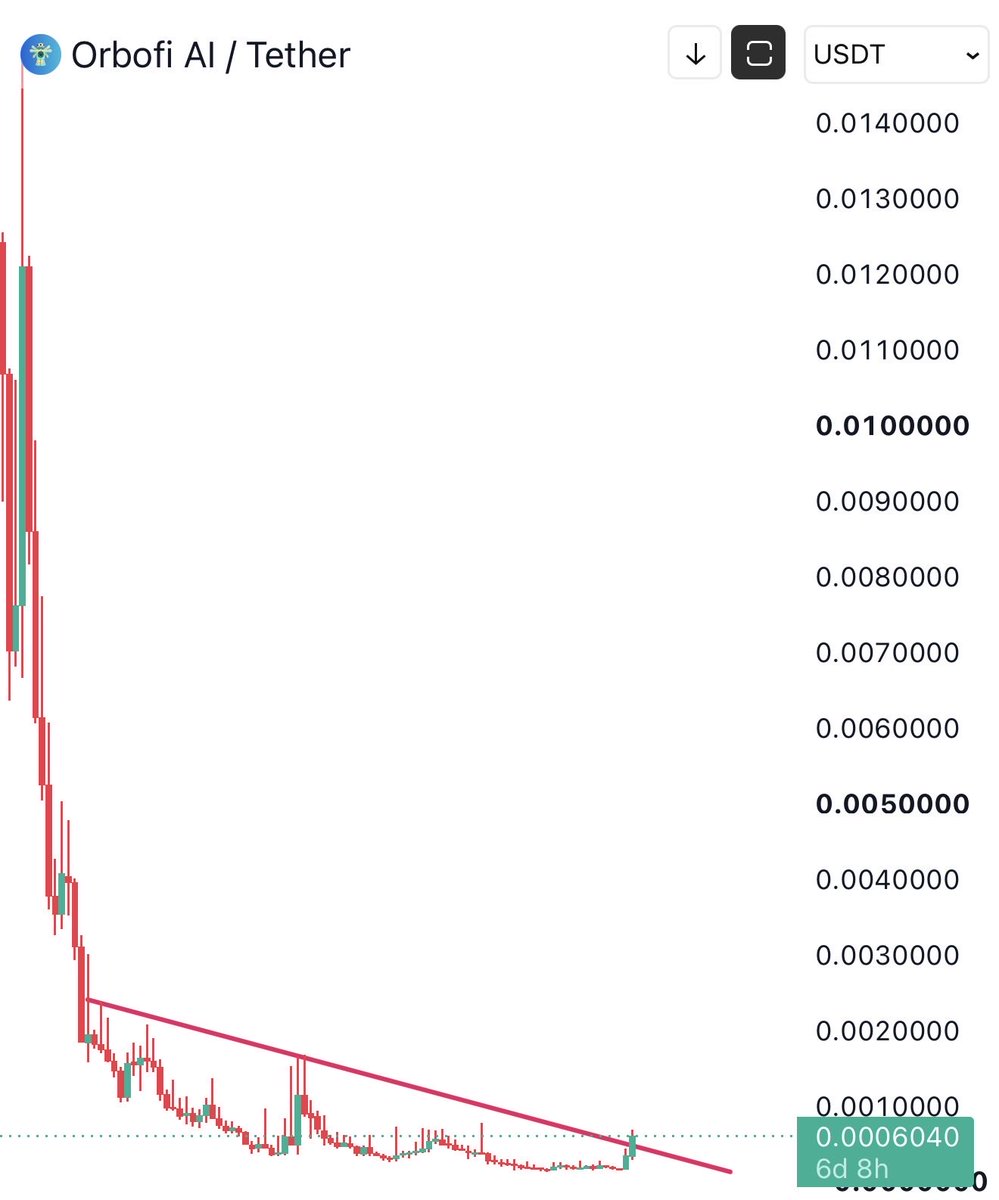
Clean bounce off the trendline near 0.00048, then a straight send to 0.00104. That's +116% off the level.
It's cooled to around 0.00072 now. That's healthy after a move this size. If the trendline zone holds on a retest, I'm watching for round two.
Who caught this one?
#Orbofi #AI #Crypto
$OBI is showing the first signs of a potential trend reversal.
The interesting part isn’t the bounce itself.
It’s the structure.
Selling pressure has gradually faded, price has built a base near the lows, and now we’re testing a descending trendline that has held for months.
A confirmed breakout and successful retest would be the first meaningful shift in market structure.
Still early, but definitely one for the watchlist.
$OBI is attempting to break a multi-year descending resistance on the weekly chart.
Years of lower highs, prolonged compression, and fading momentum.
Now price is finally challenging the trendline that has capped every major recovery.
A confirmed weekly close above this structure could mark a significant shift in the long-term trend.
One to watch closely. @Orbofi
$OBI is showing the first signs of a potential trend reversal.
The interesting part isn’t the bounce itself.
It’s the structure.
Selling pressure has gradually faded, price has built a base near the lows, and now we’re testing a descending trendline that has held for months.
A confirmed breakout and successful retest would be the first meaningful shift in market structure.
Still early, but definitely one for the watchlist.
I think $DUSK is setting up for a much bigger move.
Months of selling pressure, a clear bottom formation, and now buyers are aggressively defending the $0.075–$0.085 zone.
Price is starting to reclaim resistance while the structure shifts bullish.
$0.1238 is my first target, followed by $0.145 and $0.166.
Wouldn’t be surprised to see this one catch people completely off guard.
@DuskFoundation
$ROSE looks ready for a serious move.
Higher lows stacking up, buyers defending every pullback, and price pushing back toward local highs.
This is how momentum starts building before the crowd catches on.
$0.0122 is the first major level to reclaim.
Above that, $0.0151 and $0.0197 come into play.
I think people are sleeping on this chart.
$FLOW is starting to look interesting here.
Long-term rounding bottom, higher lows developing, and price compressing right beneath the neckline.
This is exactly the kind of structure I like watching before volatility expands.
A confirmed breakout above $0.036–$0.038 could open the path toward $0.075.
That’s roughly 115% upside from here. The structure is there. Now price needs to confirm it.
#Binance
@elonmusk 👌😊 Good Morning
And it's ok to be different
Brings something else to the world .. of beauty
That imagination
And there is those who make one feel this.. when the rest of the world sees what is simple and what is only shown .. to fit it
We compared 2 Step Flex to the competition.
They give you 8% drawdown. We give you 12%.
They force 5 trading days. We require zero.
They cap you at 80-90%. We go up to 95%.