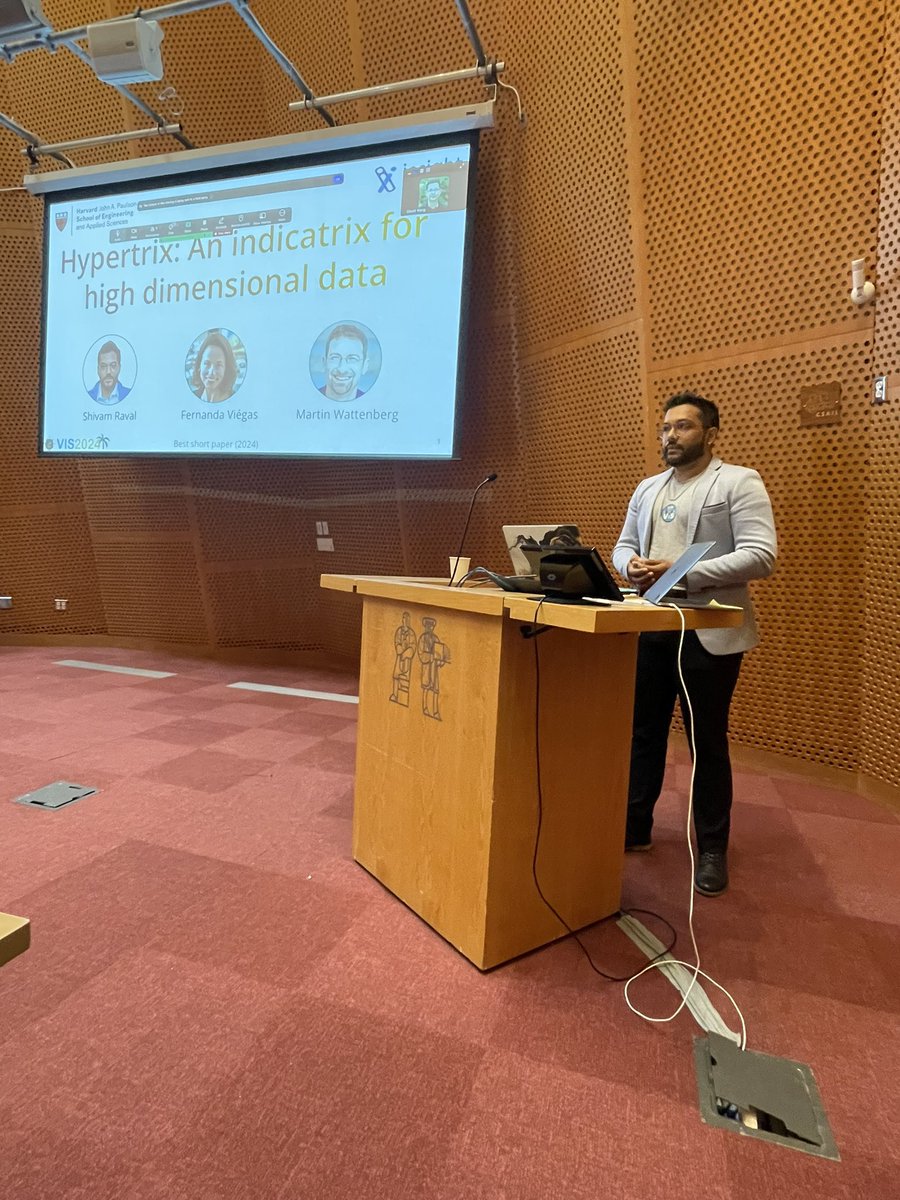
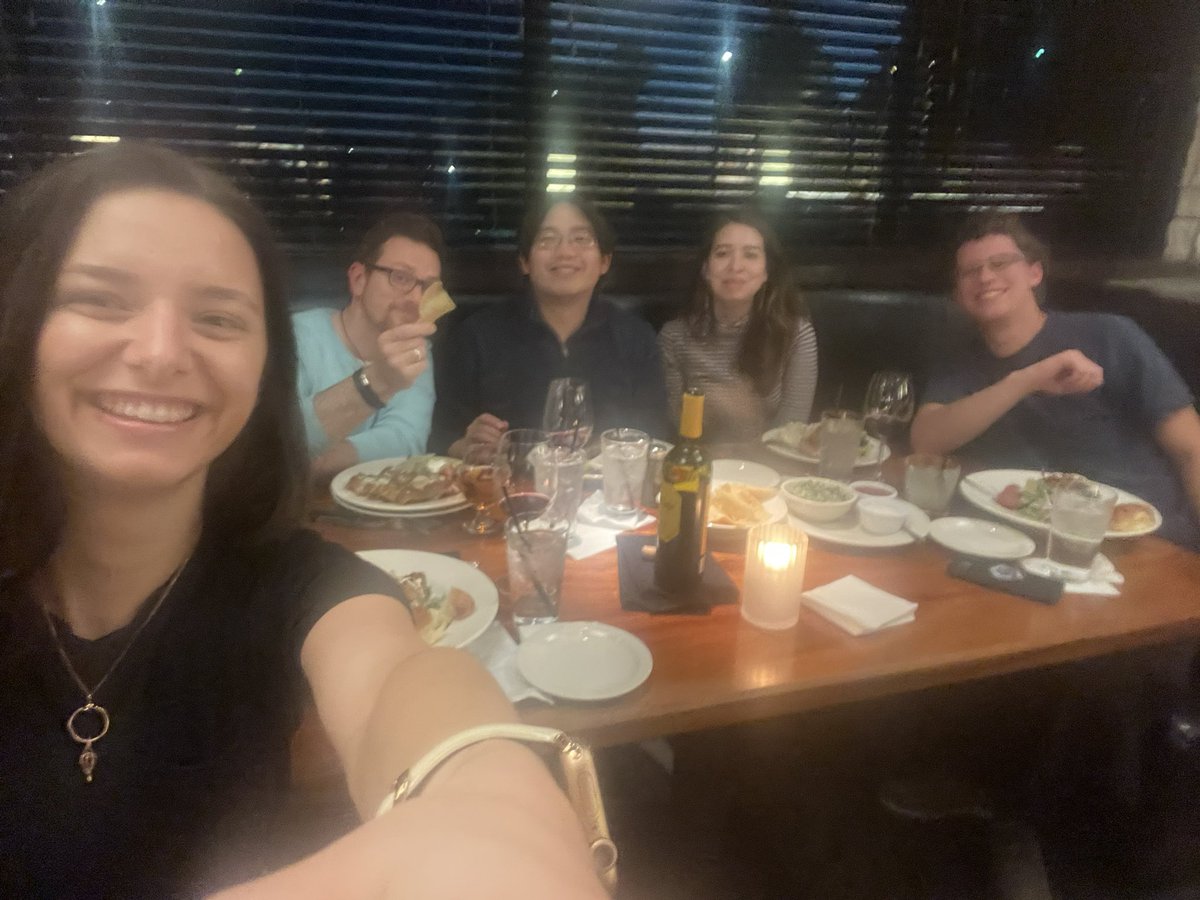
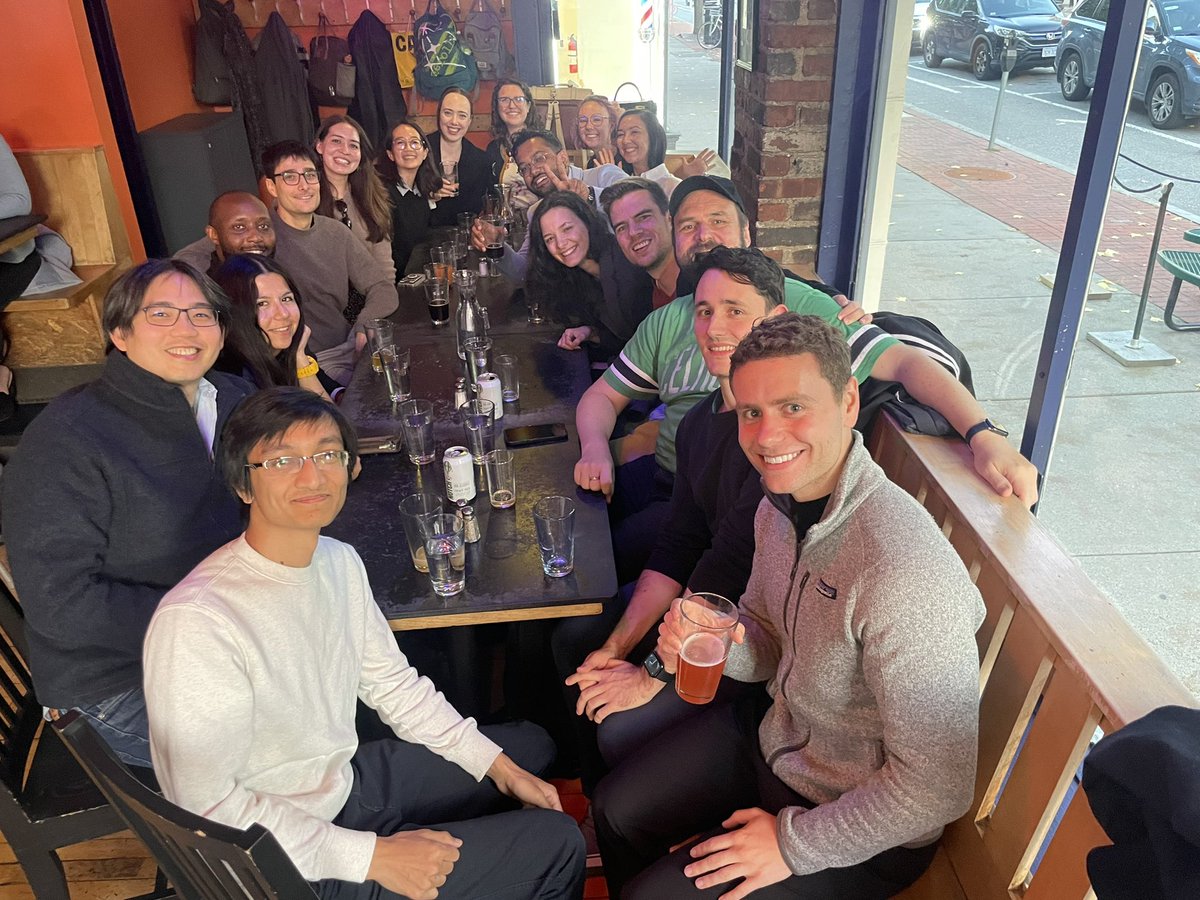
✨Day 2 of Boston VIS was fantastic! 🫶🏼 We hosted a watch party, had a live talk from Best Short Paper winner @shivamravalxai 🏆, enjoyed delicious pastries and coffee, and wrapped up with a fun end-of-day party. 🎉
https://t.co/XtKUuzvHDS
@ieeevis
Kicked off the BostonVis mini-conference with an inspiring keynote by @davidbau at @VISxAI! 🎉 Excited to see the community grow around cutting-edge #Visualization and #AI insights. Check us out at https://t.co/HQzNFsdA8p! @ieeevis
Former VALT lab master's student Harry Li delivered a stellar presentation on our work "Characterizing Users, Challenges, and Visualization Needs of Knowledge Graphs in Practice" at IEEE VIS 2023! 👏🎆 #IEEEVIS2023#KnowledgeGraphs
📸: @NotAshleySuh
I've recently started delving into the history, current state, and future of Visual Analytics. I've found several related resources linked in this 🧵, and I would greatly appreciate it if the community could share other papers/books/articles/videos that I might be missing!
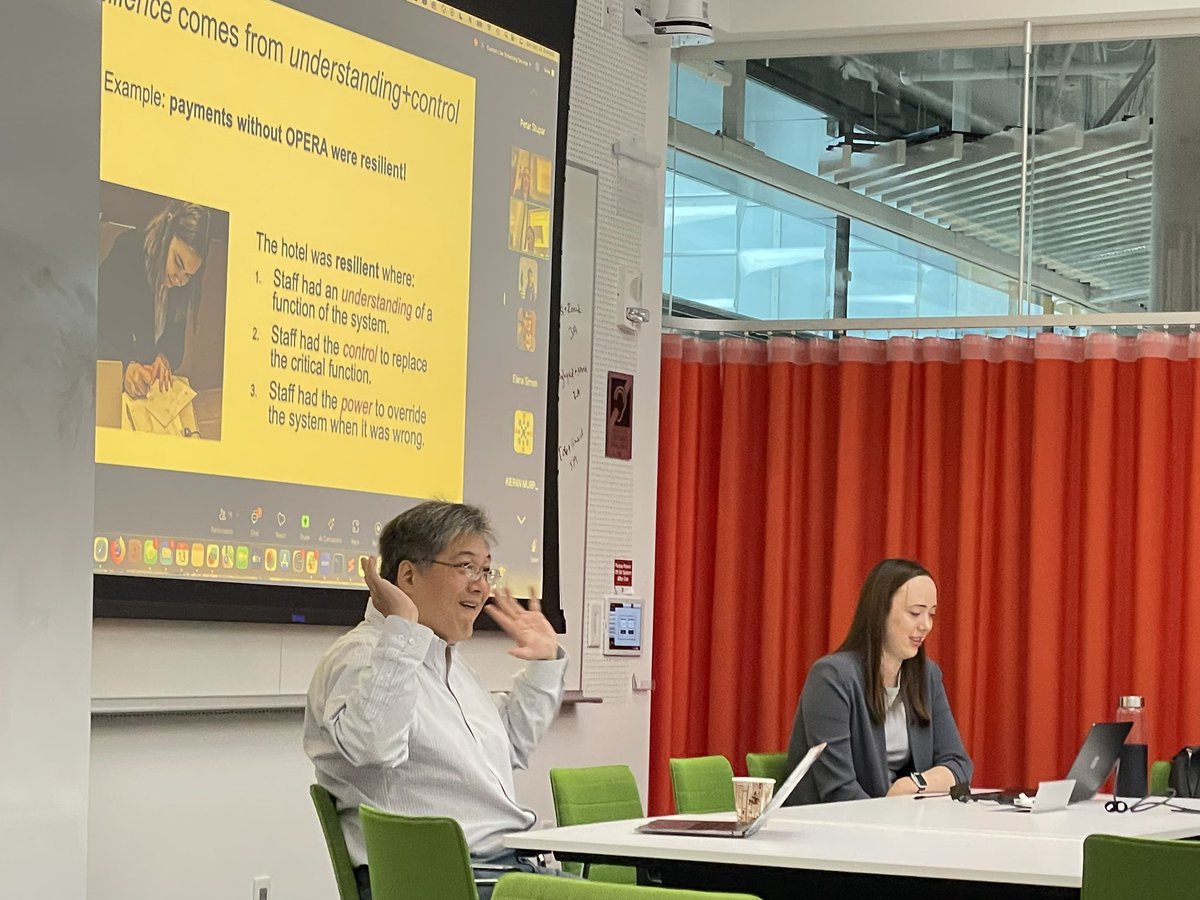
IEEE VIS’22 is over, but we’re taking home a great reflection on visual thinking by the keynote speaker Dr. Kerry Magruder. Is the history of science case studies applicable to our field? What are the cultural connections or meta-reflections which relate to our work? @ieeevis
Remco Chang in second @VisualDataSci keynote at #ieeevis:
Towards a Unifying Theory of Data, Task, and Visualization with a Grammar of Hypothesis
Argues we're too nice to each other and keep expanding scope of "task" in each paper until it's so broad that we can't operationalize
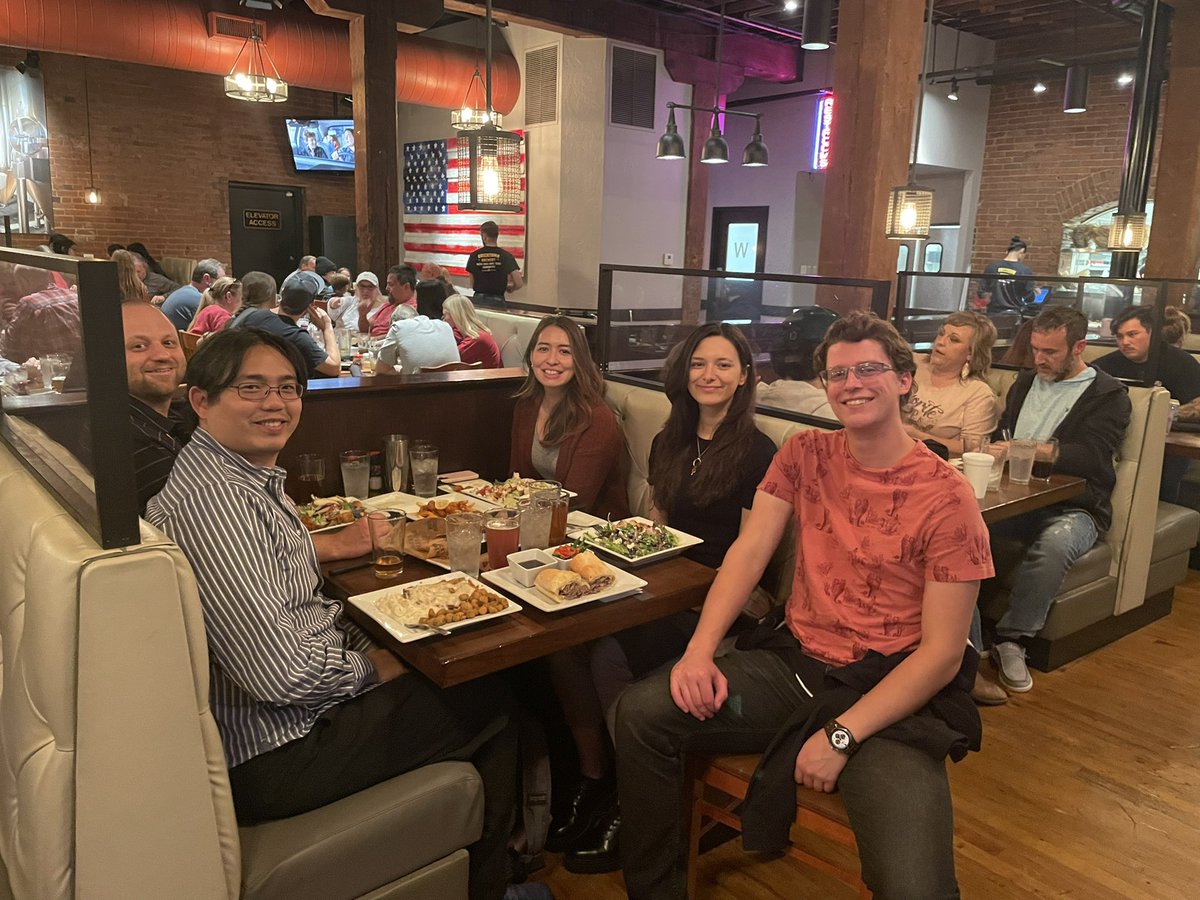
So stinkin’ proud of Eddy and Daniel, our undergrad students who presented their summer work on “Analysis Without Data: Teaching Students to Tackle the VAST Challenge” at @VisGuides — their first #ieeevis conference! https://t.co/Dkuqd3fYyj
Super pumped that people are excited about our hypothesis grammar. We’ve been thinking about this space for a while now - what questions can a visualization answer, and what questions could an analyst ask about their data? The grammar gives us a cool way to connect the dots!
Attended the Data Materialization talk by Prof. Courtney Starrett from the Texas A&M University, and Susan Reiser from the University of North Carolina at Asheville! They shared a cute example on how to map data to worry beads. So inspirational!
@art_starrett@SusanLReiser
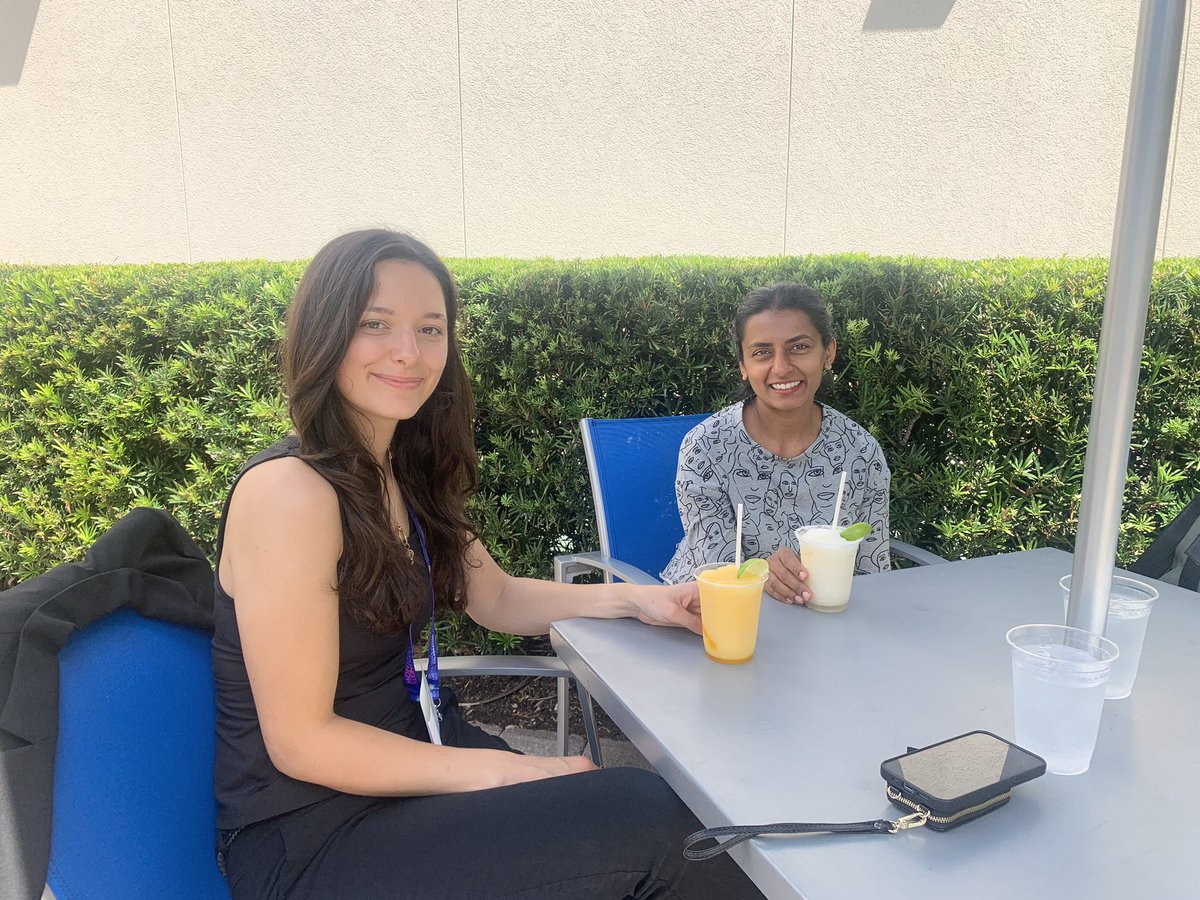
Had so much fun attending #GHC22! Not to mention that it was a pleasure to meet and chat with the director of Tableau Research, Dr. Vidya Setlur!
@vsetlur@tableau#GHC22#NextIsNow
I’m excited to join @sigmacomputing as Chief Research Scientist this week. I’d like to thank @rwoollen, @jfranty, and Mike Palmer for this unique opportunity. Also many thanks to Vic Miller and @laserlikemike from @shv for their continued support and encouragement.