Day 2 of the 2nd Annual #NatGasToPowerForum in Austin!
As natural gas and power infrastructure become increasingly important to AI data center development, we're excited to continue the conversation with industry professionals.
Kevin Kang, Senior Analyst at #Rextag, shares a few thoughts in this video.
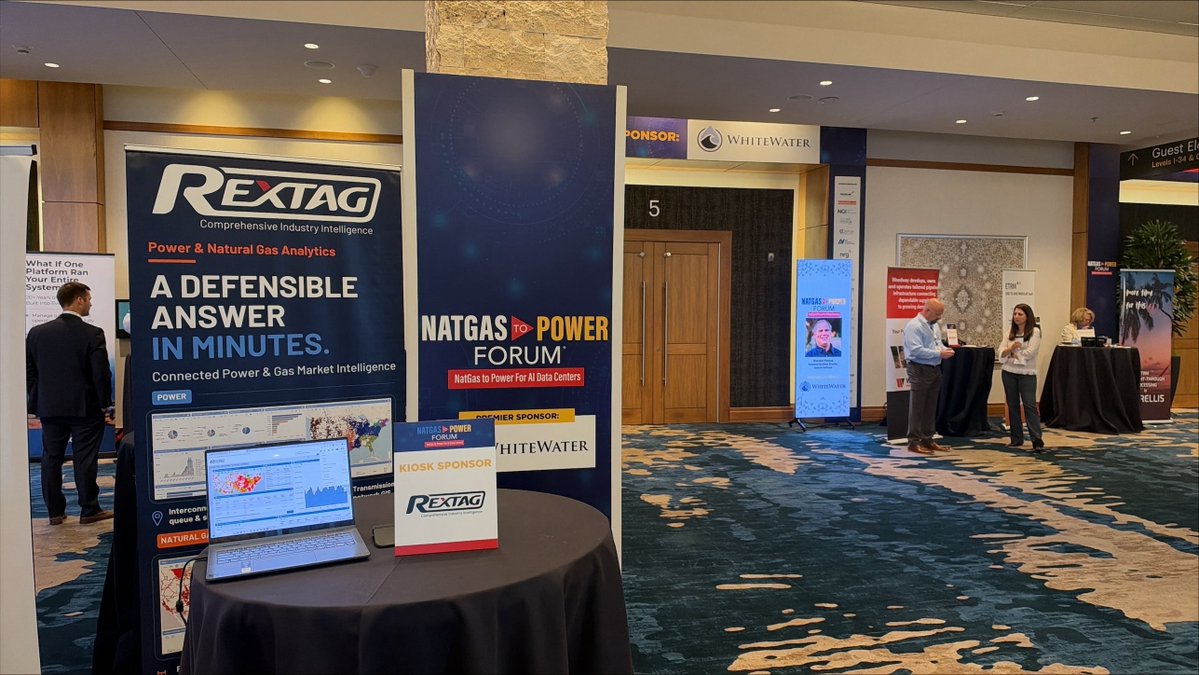
If you're attending the forum, stop by our kiosk in the foyer to meet the Rextag team and learn how our Power & Natural Gas Analytics solutions can support your business.
📍 JW Marriott Austin | November 11-13, 2026
#NGTPF26 #NatGasToPowerForum #ldcgasforums #natgas #energy #aidatacenter
We're here at the 2nd Annual #NatGas to Power Forum in Austin!
Stop by the #Rextag kiosk in the foyer to meet our team, explore our Power & Natural Gas Analytics solutions, and discuss your business needs.
We look forward to seeing you!
#NGTPF26 #NatGasToPowerForum #Rextag #NaturalGas #PowerAnalytics
We're live at the 2nd Annual #NatGas to Power #Forum in Austin, Texas!
Alex Gafford, Director of Midstream Intelligence at #Rextag, is on stage moderating the main session.
If you're attending the forum, stop by our kiosk in the foyer to meet the Rextag team and explore how our Analytics products can support your business, from natural gas market analysis to power infrastructure insights.
We look forward to connecting with you!
📍 JW Marriott Austin | November 11-13, 2026
#NGTPF26 #NatGasToPowerForum #ldcgasforums #natgas #energy #aidatacenter
Net Power just added 123 MW of gas generation to its first powered-land project in the Permian, bringing phase one to nearly 200 MW.
The company closed its acquisition of rights to 123 MW of new natural gas generation equipment for Project Permian: 10 Wärtsilä reciprocating engine-generator sets, with #Saulsbury Industries continuing as EPC contractor.
What makes this interesting: #NetPower is best known for its carbon-capture power cycle.
Project Permian starts with fast-start engines that can ramp to follow variable load, with the project designed to accommodate carbon capture in later phases.
Generation equipment is only one piece of a powered-land project. Gas supply, transmission access, and nearby large-load demand all shape where it can go.
This #Rextag map, powered by Energy DataLink, shows the approximate Project Permian area alongside the Permian Basin’s natural gas pipelines, 345+ kV and 138+ kV transmission lines, gas processing plants, gas-fired power plants, and operational data centers.
Project Permian is still under development, with financing, interconnection, and offtake still being worked through.
Read more in our blog: https://t.co/XecJhGygtC
Is “bring your own power” land the next big real estate play in the Permian?
#NaturalGas #PermianBasin #DataCenters #PowerGeneration #Texas
Is #Enbridge’s #Tallgrass deal really just a pipeline acquisition?
#Rextag helps teams see why the answer is no.
Enbridge has agreed to acquire Tallgrass Energy’s crude transportation business for $2.55 billion, adding a major Rockies-to-Cushing crude corridor to its U.S. liquids portfolio.
The transaction includes a 75% interest in Pony Express Pipeline, a 51% interest in Powder River Gateway, approximately 8.4 million barrels of terminal storage, and an interest in Deeprock Crude Terminal at Cushing.
This #Rextag map, powered by Energy DataLink, shows why the deal is really about connectivity.
It places Pony Express, Iron Horse, and Powder River Express alongside the Powder River and Denver-Julesburg basins, Guernsey and Cushing terminal context, nearby refineries, and Enbridge’s existing Platte Pipeline.
Together, those assets create a physical pathway from Rockies production toward one of the most important crude hubs in the U.S.
Enbridge will also assume the PXP² expansion, which is expected to increase Pony Express capacity from approximately 460 kbpd to 515 kbpd by late 2027.
For #Upstream, #Midstream, refining, and market intelligence teams, the key question is not only which pipelines changed hands.
It is how production basins, gathering systems, long-haul pipelines, terminals, storage, refining capacity, and market hubs connect across the corridor.
Read more in our blog: https://t.co/RnSzbub49S
Can crude infrastructure M&A be understood without mapping the connectivity behind the assets?
We're heading to Austin for the 2nd Annual #NatGas to Power Forum, November 11-13, 2026!
As #AI data centers reshape #power demand, the connection between #naturalgas infrastructure and power generation is becoming increasingly important.
Our Product Manager, Kevin, will be there to connect with industry professionals and introduce #Rextag's latest solution.
Hear more from Kevin in this short video, and explore how #Rextag Power Analytics supports energy market analysis: https://t.co/weBTB0WcfD
We look forward to seeing you in Austin!
#NGTPF26 #NatGasToPowerForum #ldcgasforums #natgas #aidatacenter #energy
We're excited to attend the 2nd Annual NatGas to Power Forum in Austin, Texas!
On November 11-13, industry professionals will come together to discuss the growing role of natural gas in power generation, including the infrastructure needs of AI data centers.
The #Rextag team looks forward to connecting with attendees, exchanging insights, and discussing how energy infrastructure data supports a better understanding of this evolving market.
📍 JW Marriott Austin | November 11-13, 2026
See you there!
Thank you to @LDCForums for organizing the event.
#NGTPF26 #NatGasToPowerForum #ldcgasforums #energy #natgas #aidatacenter #datacenter
2 GW of AI data center load just moved a step closer to the Texas grid.
#IREN’s Sweetwater Hub, made up of Sweetwater 1 (1.4 GW) and Sweetwater 2 (600 MW), has been conditionally included in #ERCOT’s Batch Zero process as Base Load.
Why that matters: Base Load status means ERCOT treats the load as already studied and part of its planning baseline, instead of sending it through more study. The classification is still conditional, but it’s a meaningful step.
And this isn’t just paper progress. The high-voltage substation at Sweetwater 1 was energized earlier this year, and 300 MW of gross data center capacity is under construction, targeted for Q4 2027.
This #Rextag map, powered by Energy DataLink, puts both Sweetwater sites in their West Texas context: 345+ kV and 138+ kV transmission lines, gas-fired power plants, battery storage, and the operational and under-development data centers across the region.
Read more in our blog: https://t.co/xaAqHAAVvR
How many GW of AI load can West Texas absorb before transmission becomes the bottleneck?
#ERCOT #DataCenters #AIInfrastructure #Texas #PowerGrid
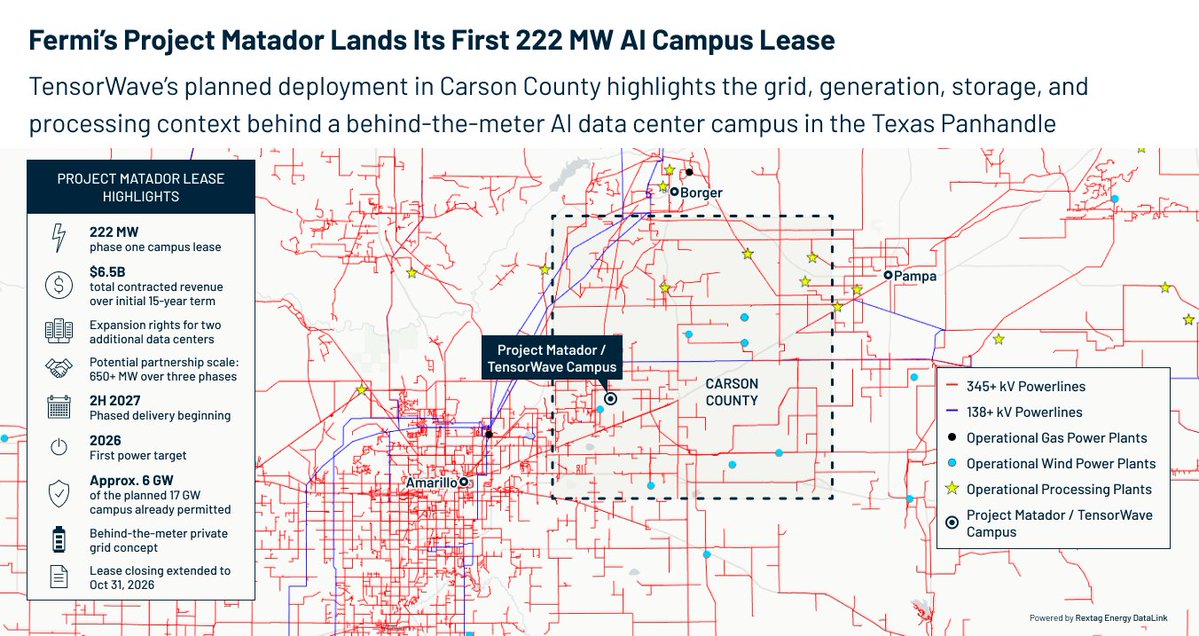
$6.5 billion in expected revenue. 15 years. 222 MW.
That’s the first tenant deal at #Fermi’s planned 17 GW Project Matador campus in the Texas Panhandle.
#Fermi America has signed a binding lease with #TensorWave for the first phase of the campus in Carson County, Texas. The campus is being designed to support tens of thousands of AMD Instinct GPUs, with phased delivery beginning in the second half of 2027.
Expansion rights for two more data centers could take the partnership past 650 MW across three phases.
One note: the lease hasn’t closed yet. The parties recently extended the closing date to October 31, 2026 while they finalize guaranties and project financing.
The bigger story is how this campus is being built: power first. Project Matador is designed as a behind-the-meter private grid, with about 6 GW of the planned 17 GW already permitted.
This #Rextag map, powered by Energy DataLink, shows Project Matador alongside the Panhandle’s high-voltage powerlines, gas and wind generation, and gas processing plants.
Read more in our blog: https://t.co/fdFQ3hpbIL
When AI campuses build their own grids, which infrastructure matters most: gas supply, transmission, or generation mix?
#DataCenters #AIInfrastructure #Texas #NaturalGas #Power
Is #Magnolia’s WildFire deal really a Giddings infrastructure story?
#Rextag helps teams see why the answer is yes.
#Magnolia Oil & Gas announced an agreement to acquire WildFire Energy for approximately $4.06 billion.
The transaction adds about 810,000 net acres in Giddings and more than doubles Magnolia’s position in the area.
But the story is not only acreage scale.
This #Rextag map, powered by Energy DataLink, shows Magnolia and WildFire acreage around Giddings Field, with natural gas gathering pipelines, natural gas transmission pipelines, major crude oil pipelines, operational gas processing plants, and formation context for the Austin Chalk, Eagle Ford, and Woodbine.
That context matters because the WildFire assets add more than acreage.
Magnolia said the transaction includes more than 500 miles of gas gathering pipelines in Giddings and a sand mine that supplies about 80% of the company’s annual sand consumption.
For #Upstream, #Midstream, M&A, and market intelligence teams, the key question is not only how much acreage changed hands.
It is how acreage, formations, gathering systems, takeaway routes, processing assets, and market access fit together in one South Texas development footprint.
Read more in our blog: https://t.co/Lkj0Hth5Ec
Can upstream acquisitions be understood without mapping the infrastructure around the acreage?
Can northern Ontario’s growing electricity needs be understood without looking at the transmission network behind them?
#Rextag helps teams see why the answer is no.
Hydro One and Hydro One Sault Ste. Marie have filed for approval to construct the North Shore Link, an approximately 105 km, double-circuit 230 kV transmission line.
The proposed corridor would connect Mississagi Transformer Station near Wharncliffe with Third Line Transformer Station in Sault Ste. Marie.
The $1.3 billion project also includes upgrades at Mississagi TS and Third Line TS, plus expansion of Algoma TS, with the new line planned to enter service in 2029.
This Rextag map, powered by Energy DataLink, places the proposed North Shore Link inside Hydro One’s broader Ontario transmission network.
It shows operational 230 kV+ powerlines and substations across the province, with the proposed corridor and its key project stations highlighted separately.
That context matters because transmission expansion is not only about adding new line mileage.
It is about where new capacity connects into the existing high-voltage network, which substations anchor the corridor, and how regional connectivity changes as electricity demand grows.
For #Power, transmission, industrial development, and market intelligence teams, the key question is not only where a new line is planned.
It is how that line fits into the network around it.
Read more in our blog: https://t.co/NPYiNtromu
Can major transmission projects be fully understood without mapping the high-voltage network they connect into?
Can West Virginia dry gas growth be understood by production volumes alone?
#Rextag helps teams see why the answer is no.
#Antero Midstream said it began construction on East Side Express in Q2 2026, describing it as the company’s first intrastate regional pipeline.
The project is an east-west bi-directional pipeline designed to improve regional connectivity within Antero’s operating areas and support future dry gas growth in West Virginia.
This #Rextag map, powered by Energy DataLink, shows the approximate East Side Express corridor alongside Antero Midstream pipelines, acreage context, EGTS, Rover, Columbia Gas Transmission, compressor stations, fractionators, and Marcellus / Utica shale context.
The #EastSideExpress route is shown approximately because the company release does not provide a detailed route alignment.
That infrastructure context matters because Appalachian gas growth is not only about higher production volumes.
It is about how gathering systems, regional pipelines, long-haul transmission corridors, compression, fractionation, and market access connect in one network.
Antero Midstream gathered over 4.1 Bcf/d during the quarter, a company record, with gathering volumes up 19% and compression volumes up 17% year over year.
For #Midstream, #NaturalGas, upstream, and market intelligence teams, the key question is not only how much gas is moving through the system.
It is how that gas connects to the regional infrastructure around it.
Read more in our blog: https://t.co/MbnE7O5xXD
Can #Appalachian gas growth be understood without mapping the connectivity behind it?
400 MW of AI compute. Its own gas-fired power. No waiting on the grid.
#PowerPlay AI just announced an initial 400 MW behind-the-meter #AI#datacenter in the greater Abilene area of West Texas, developed through a joint venture with a Nasdaq-listed neocloud partner. Behind-the-meter power delivery is targeted for 2028.
Abilene is already one of the most closely watched AI power markets in the country. PowerPlay AI says the site is anchored by existing #naturalgas and fiber infrastructure, near multiple GW-scale AI campuses that are operating, under construction, or proposed.
So why map the grid around a project built to run on its own power?
Because behind-the-meter doesn’t mean isolated. Future interconnection options, backup supply, and competition from neighboring large loads all shape how a campus like this develops.
This #Rextag map, powered by Energy DataLink, places the Greater Abilene project alongside Texas’s operational and under-development data centers, 345+ kV and 138+ kV transmission lines, and substations statewide.
Read more in our blog: https://t.co/7EnDRSH2wY
Is behind-the-meter gas becoming the default path for AI campuses in West #Texas, or a bridge until the grid catches up?
Is #Targa’s ExxonMobil agreement really a Permian system buildout story?
#Rextag helps teams see why the answer is yes.
#TargaResources announced new 20-year integrated midstream agreements with #ExxonMobil across the Permian Basin.
The agreements add and extend acreage dedications in the Permian Delaware and Permian Midland, covering gathering, processing, treating, NGL transportation, and fractionation through 2046.
But the story is not only a long-term commercial agreement.
This #Rextag map, powered by Energy DataLink, shows Targa operational and under-development natural gas pipelines, Bull Run II, ExxonMobil and XTO acreage, the Bone Spring / Wolfcamp shale outline, Waha Hub, and Mont Belvieu downstream NGL context.
The buildout is significant.
Targa announced three new Permian Delaware gas processing plants, Wrangler, Ranger, and Ranger II, adding approximately 825 MMcf/d of aggregate new processing capacity.
It also announced Bull Run II, an approximately 70-mile natural gas pipeline designed to move residue gas from the new plant additions to the Waha Hub.
That matters because Permian midstream growth is not only about acreage dedications or plant capacity.
It is about how producer acreage, gathering systems, processing plants, residue gas takeaway, Waha access, and downstream NGL services connect in one system.
For #Midstream, #NaturalGas, #NGL, upstream, and market intelligence teams, the key question is not only what Targa and ExxonMobil agreed to.
It is where that agreement translates into physical infrastructure across the Permian.
Read more in our blog: https://t.co/DYxzsnAQ8y
Can Permian midstream growth be understood without mapping the system behind it?
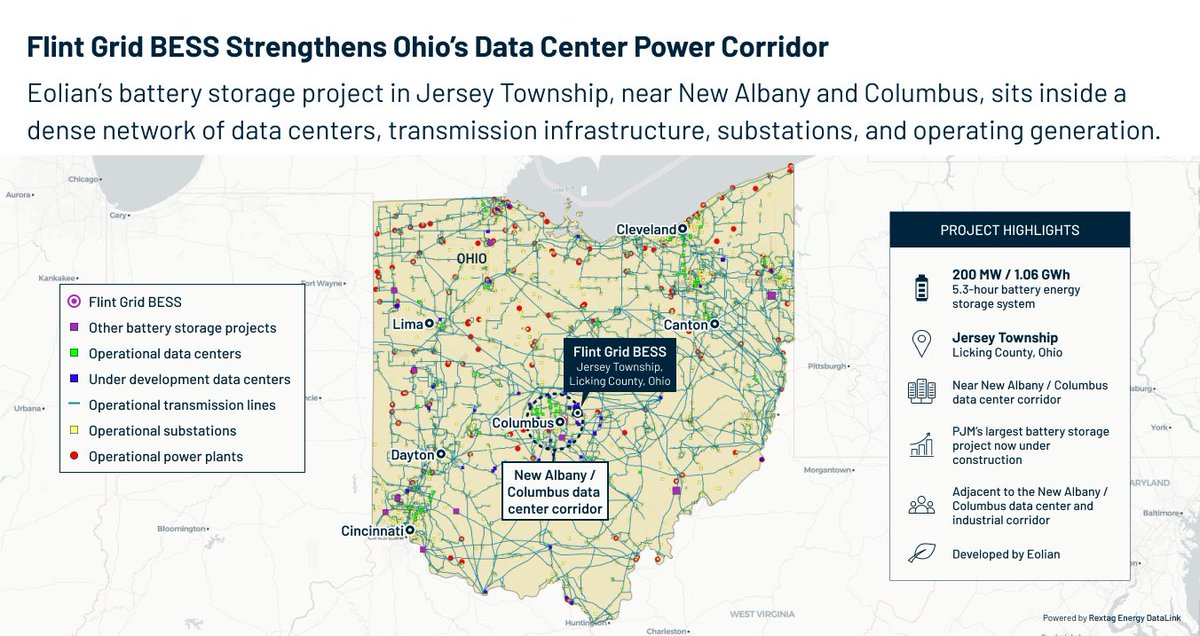
The largest battery in PJM is now under construction, right next to one of America’s busiest #datacenter corridors.
#Eolian has started building Flint Grid, a 200 MW / 1.06 GWh battery energy storage system in Jersey Township, Licking County, Ohio.
A few numbers that stand out:
· 5.3 hours of duration, longer than the typical 4-hour battery
· More than 50% of all new battery capacity that cleared PJM’s 2027/2028 capacity auction
· The first grid-scale battery storage project permitted by the Ohio Power Siting Board
Location matters as much as size. Flint Grid sits beside the New Albany / Columbus corridor, which Eolian calls one of America’s fastest-growing data center and industrial load centers.
This #Rextag map, powered by Energy DataLink, puts Flint Grid on the same view as Ohio’s operational and under-development data centers, transmission lines, substations, power plants, and other battery storage projects.
That’s how storage should be evaluated: not just by megawatts, but by where those megawatts sit relative to demand, substations, and the rest of the grid.
Read more in our blog: https://t.co/vXhRogeSeP
Will long-duration storage like this become standard next to every major data center cluster in PJM? Curious what grid planners are seeing.
Is #ATCO’s #Yellowhead Pipeline only a pipeline approval story?
#Rextag helps teams see why the answer is no.
ATCO announced that Canadian Utilities, an #ATCO company, received Alberta Utilities Commission approval to construct and operate the Yellowhead Pipeline Project.
The approved project includes a 235-km, 36-inch natural gas transmission pipeline from the Peers area to the Fort Saskatchewan area, plus one compressor station.
ATCO says the project is fully contracted and, once in service, is expected to deliver more than 1 Bcf/d of natural gas to Alberta’s industrial heartland.
But the infrastructure story is bigger than route length or diameter.
This #Rextag map, powered by Energy DataLink, shows the #Yellowhead Pipeline corridor within #Alberta’s broader natural gas infrastructure context.
The map includes ATCO / ATCO Next transmission pipelines, ATCO compressor stations, operational gas processing plants, operational natural gas power plants, and the Duvernay shale area.
That context matters because major gas projects are not only about new pipe.
They are about how supply areas, transmission systems, compression, processing, power generation, and industrial demand connect in one regional network.
For #Midstream, #NaturalGas, power, industrial development, and market intelligence teams, the key question is not only where the route runs.
It is how that route fits into Alberta’s gas supply and demand corridor.
Read more in our blog: https://t.co/jVqmBT6efQ
Can Alberta gas infrastructure growth be understood without mapping the corridor around it?
Can you understand tomorrow's natural gas supply picture by looking only at today's production?
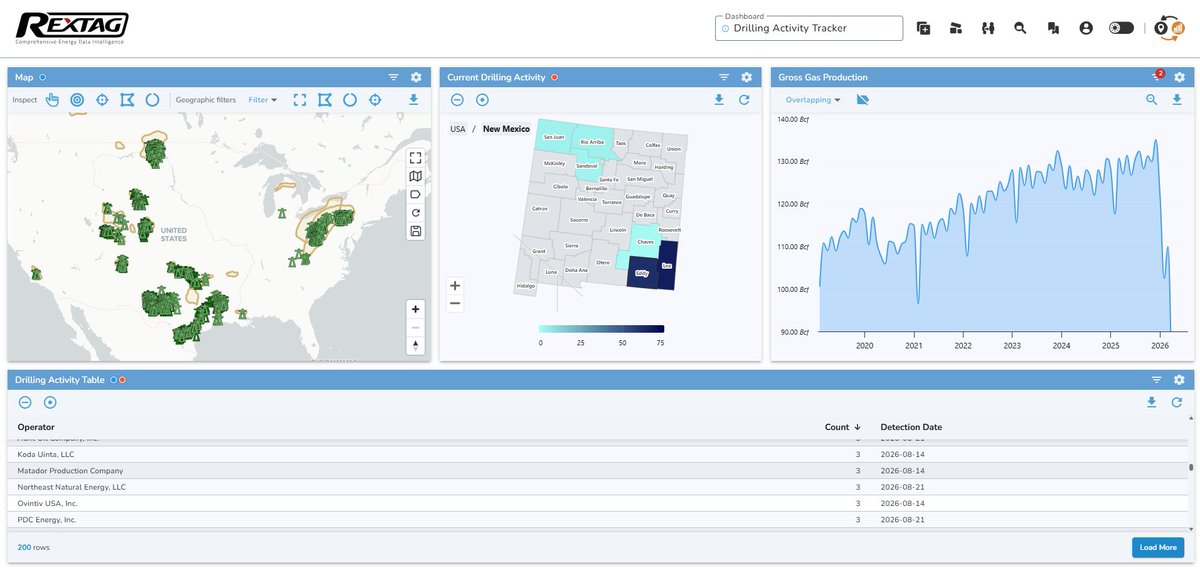
#Rextag#NaturalGas#Analytics incorporates satellite-driven drilling activity intelligence that identifies activity such as operating rigs, completion crews, and frac crews.
#Upstream activity can provide an important additional layer of context.
Instead of viewing production, pipelines, and upstream development separately, teams can examine where field activity is occurring in relation to the surrounding natural gas system.
- Which areas are seeing new drilling activity?
- Where are completion crews becoming more active?
- Which operators and producing regions deserve a closer look?
It is another way to connect what is happening #upstream with the #infrastructure and market data further #downstream.
Explore #Rextag Natural Gas Analytics: https://t.co/q6hBKluiF8
What changes when you can see drilling activity and the gas network in the same analytical environment?
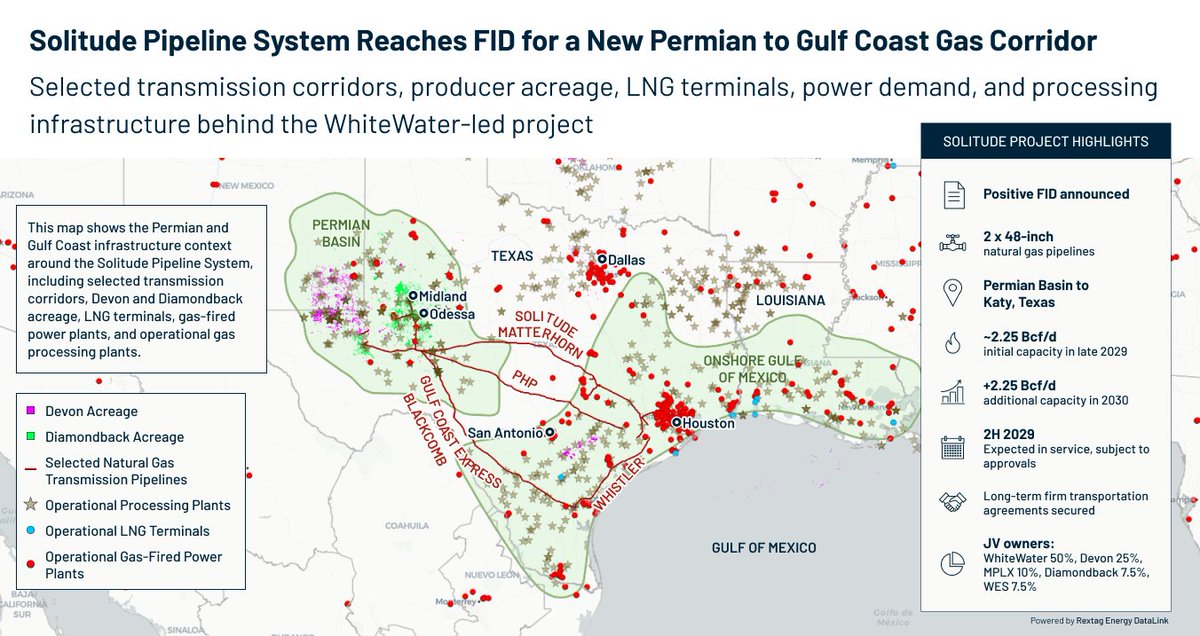
Is #Solitude the next big test for Permian gas takeaway?
#Rextag helps teams see why the answer may be yes.
#WhiteWater, #DevonEnergy, #MPLX, #Diamondback Energy, and #WesternMidstream reached a positive FID for the Solitude Pipeline System.
The project includes two 48-inch natural gas pipelines from the #PermianBasin to Katy, Texas.
It is designed for approximately 2.25 Bcf/d of initial capacity in late 2029, with another 2.25 Bcf/d expected in 2030.
But the story is not only a new route from basin to market.
This #Rextag map, powered by Energy DataLink, shows the broader infrastructure context around the announcement.
The map includes Devon and Diamondback acreage, selected natural gas transmission corridors, operational gas processing plants, operational #LNG terminals, and operational gas-fired power plants.
Those selected corridors are shown for context and do not represent Solitude’s exact route unless specifically labeled.
That context matters because Permian gas takeaway depends on more than pipeline capacity.
It depends on how producer acreage, processing plants, long-haul pipelines, LNG demand, and power generation connect across the same regional system.
For #Midstream, #NaturalGas, LNG, power, and market analysis teams, the key question is not only how much new capacity is being added.
It is how that capacity fits into the existing Permian-to-Gulf Coast gas corridor.
Read more in our blog: https://t.co/QIIl6MLtIz
Can Permian gas takeaway be understood without mapping the infrastructure corridor behind it?
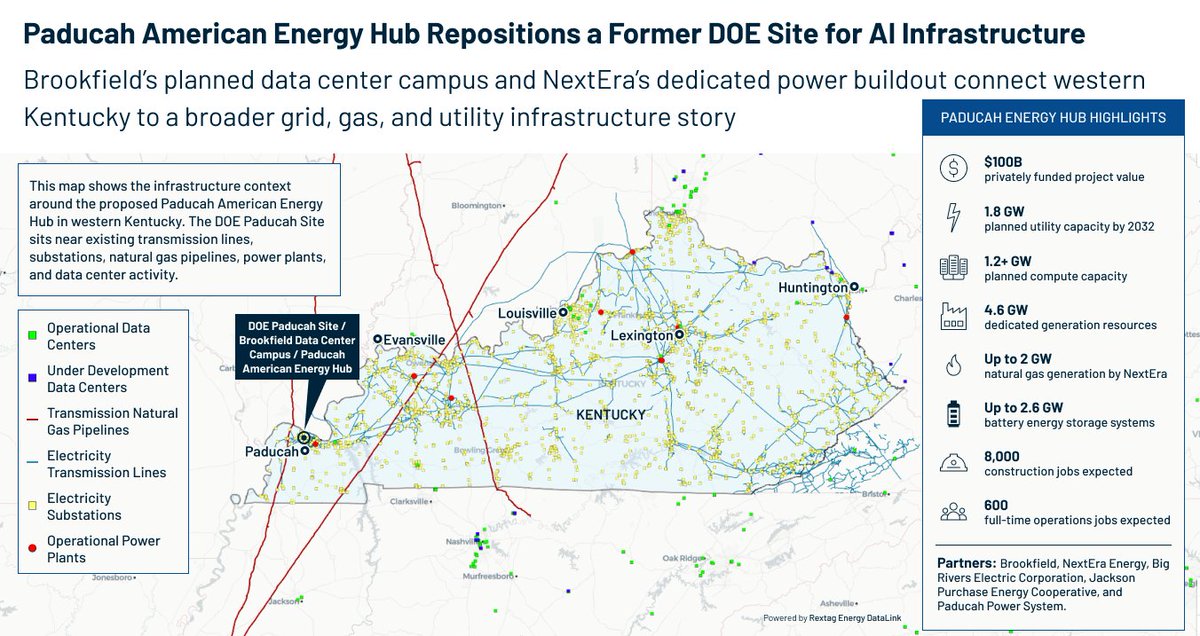
Can a former DOE site become a major AI power hub?
#Rextag’s map, powered by Energy DataLink, places the proposed #Paducah American Energy Hub alongside the power and gas infrastructure around it.
It gives data center, utility, and investment teams a regional view of the systems they need to examine as projects grow to gigawatt scale.
#Brookfield, #NextEra Energy, #BigRivers Electric Power Corporation, #JacksonPurchase Energy Cooperative, and #PaducahPower System have announced plans to redevelop the former DOE Paducah Site in western Kentucky. The project has been described as a $100 billion private investment.
By 2032, plans call for up to 1.8 GW of utility capacity supporting more than 1.2 GW of compute capacity. Proposed dedicated energy resources include up to 2 GW of #naturalgas generation and up to 2.6 GW of battery storage.
#Rextag’s map shows the proposed site with nearby transmission lines, substations, natural gas pipelines, power plants, and operational and under-development data centers. These layers show regional infrastructure context; they do not establish which nearby assets will serve the project.
#Paducah illustrates a broader shift in AI site selection: the question is increasingly how land, power, and supporting infrastructure come together in one location.
Read more in our blog: https://t.co/ujRFP2NtId
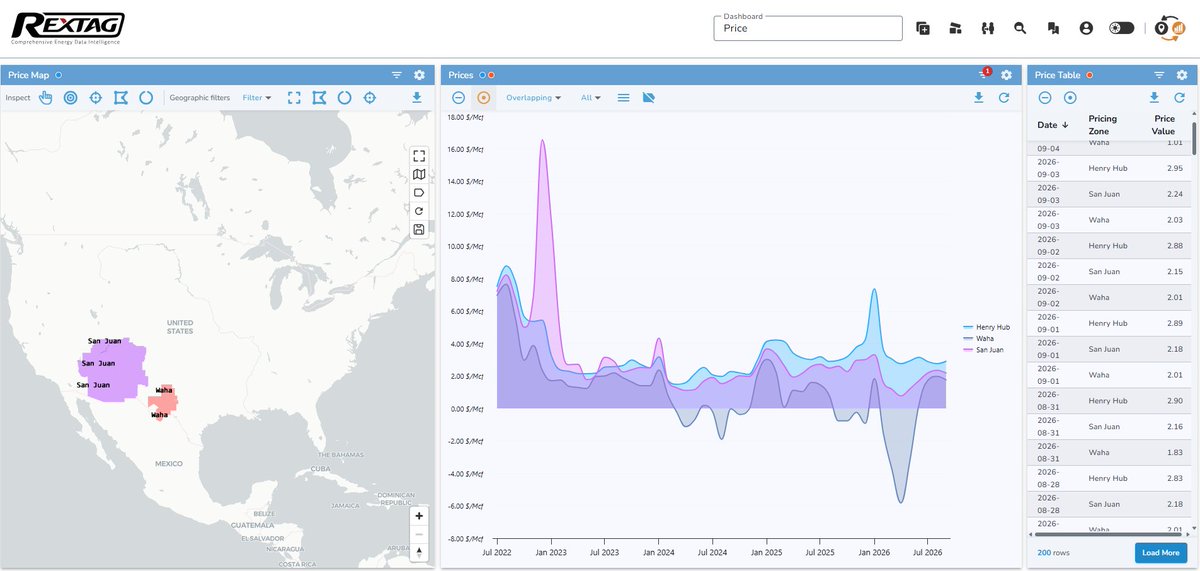
A price tells you what the market is doing. But can you see what is happening around it?
Regional #naturalgas#pricing becomes more useful when it can be viewed alongside the physical system moving the gas.
#Rextag#NaturalGas#Analytics brings regional pricing together with pipelines, flows, production, storage, and other market context, helping analysts look beyond the price point itself.
A regional move can then be explored against questions such as:
- What is happening to flows in the surrounding systems?
- Are infrastructure conditions changing at the same time?
- How has the relationship between regional pricing and physical gas movements changed over time?
The goal is not to look at pricing and infrastructure as separate datasets, but as different parts of the same natural gas market.
Explore #Rextag #NaturalGas #Analytics: https://t.co/iY5yj16FJj
When a regional gas price moves, what does the infrastructure around it show you?