BREAKING: 🇺🇸 The U.S. is reportedly considering an initiative to promote dollar-backed stablecoins globally, according to Bloomberg.
This could be a major development for crypto.
Dollar stablecoins are already a $300B+ market, with USDT and USDC controlling more than 80% of total stablecoin value.
And the bigger story?
If the U.S. actively pushes regulated digital dollars worldwide, stablecoins could become an even bigger part of:
• Global payments
• Cross-border settlements
• Crypto liquidity
• Dollar access in emerging markets
• Demand for U.S. Treasuries
More than 80% of dollar-backed stablecoin transactions already take place outside the United States.
The dollar isn’t just going digital.
It could be going on-chain globally. 🇺🇸
Massive development to watch for $BTC and the entire crypto market.
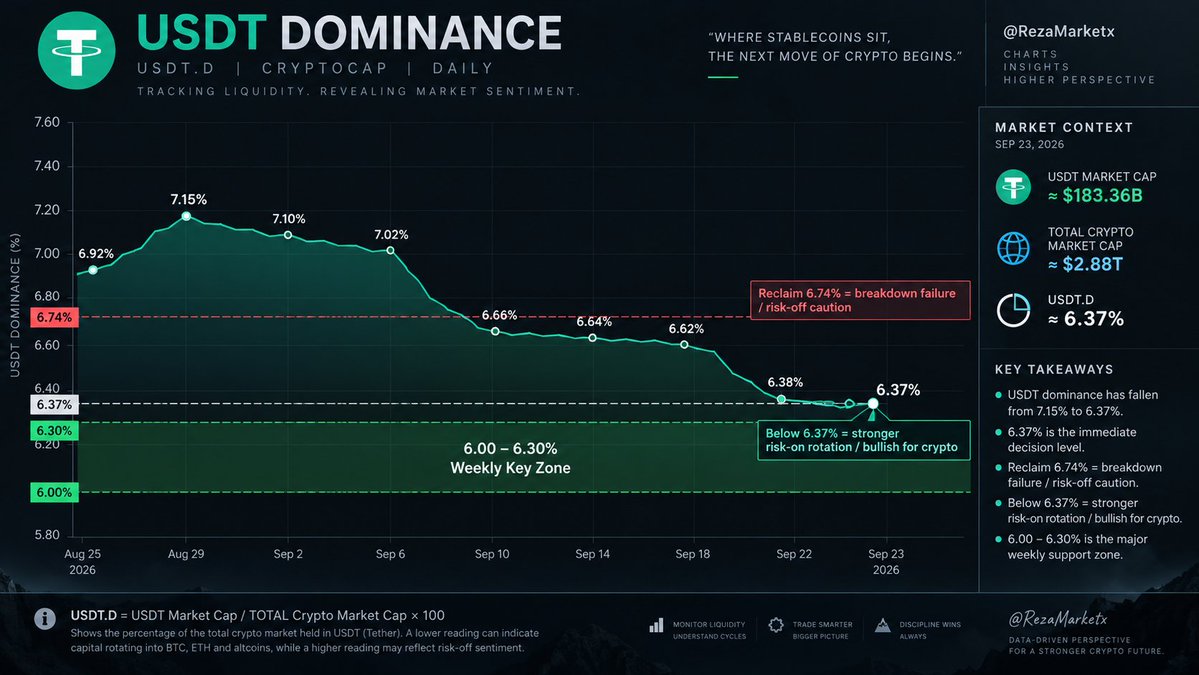
🚨 USDT DOMINANCE AT A MAJOR DECISION POINT
USDT.D is now sitting around 6.07% and this is one of the charts I’m watching very closely.
For perspective:
• Total crypto market cap: ~$3.01T
• USDT market cap: ~$183B
• USDT dominance: ~6.07%
• Total stablecoin share: ~10.24%
Why does this matter?
USDT dominance tells us how much of the crypto market is sitting in Tether relative to the broader market.
📉 USDT.D falling can signal stronger capital rotation into BTC, ETH and altcoins.
📈 USDT.D rising can indicate investors moving toward stablecoins and reducing risk exposure.
The key area on my chart now is 6.0%.
A clean breakdown below this zone, especially with expanding crypto market capitalization, would strengthen the risk-on case.
But if USDT.D holds 6% and starts reclaiming higher levels, I’d be more cautious with aggressive altcoin exposure.
Don’t just watch BTC. Watch where the liquidity is sitting.
USDT.D could tell us a lot about the market’s next move. 👀
$BTC $ETH $USDT #Crypto
$BTC looking spicy on the 4H + 30M 👀
Tony’s count has wave (iv) wrapping up the ABC pullback near $84.4k–$85.6k after that clean impulse off the $75k low. If this holds, wave (v) has room toward $90.5k–$91k+.
Classic “just imagine if it plays out” setup. Elliott Wave never guarantees anything, but the structure is clean right now.
Not financial advice.
Charts can invalidate fast. What’s your invalidation level? 👇
#Ethereum is trading near $2.74K after breaking out of a month-long bull flag.
My levels:
Hold $2.66K → $3.05K
Lose $2.66K → $2.56K retest
Daily close below $2.35K = breakout failed
$2.77K–$2.82K is the resistance zone to watch.
$ETH
USDT.D still has that last flush lower to print.Chart’s already rolled over hard from the 7.2% area.
The next obvious magnet is that lower line around 6.15–6.20 before any real bounce. As long as that happens, risk-on in crypto stays in play.
Not calling the exact bottom on dominance, just following the structure Tony posted.
Lower USDT dominance = more capital rotating out of stables and into BTC/alts.Watch the reaction at that support. If it tags it and holds the higher low structure, the “more upside on crypto” thesis remains intact.
If it slices through cleanly, we reassess. Not financial advice. Just reading the same chart.
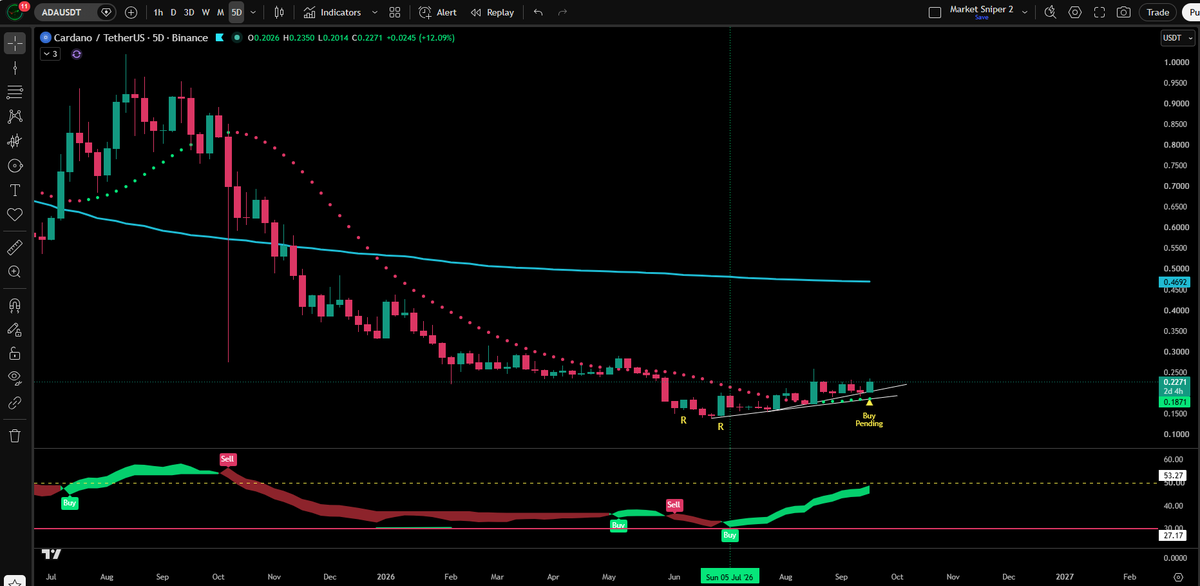
Weekly close confirming what the daily has been building for months. Reversal candle + RSI buy + green trending dots on $ADA after four higher lows and bullish divergence is decent multi-timeframe confluence, not just a single-indicator ping. The setup now lives or dies on whether price can hold above the rising trendline and convert the old $0.23–$0.25 area into support. If it does, this looks like an early swing long; if it fails quickly, it was just another bounce in a larger downtrend.
$ADA will close this week with a buy signal.
Reversal candle -> RSI buy signal -> Green trending dots
Reversal signs have been flashing for months.
@joao_wedson Worth watching the transition, not just the extreme.
A sub-1 LTH/STH SOPR ratio means long-term holders are realizing worse outcomes than short-term holders.
For $BTC, the stronger confirmation is the ratio bottoming, reclaiming 1.0, and price holding structure.
8/ Recap
3 levels. That’s it.
BTC: $82K 🥇 Gold: $4,407 💵 DXY: 100.60
Break them, and momentum can expand.
Reject them and we stay range-bound.
Which one breaks first?
$BTC $XAUUSD $DXY
1/ Market Map
Markets heading into Monday:
BTC: $81.2K
ETH: $2.64K
Gold: $4,378
DXY: 100.19
US10Y: 5.01%
BTC is pushing resistance while macro stays tight.
These are the levels on my screen 👇
7/ Monday Scenario
Monday playbook:
DXY > 100.00 + US10Y holds 5% → Gold may reject $4,400–$4,407.
DXY < 99.80 + yields ease → Gold breakout gets more interesting.
I don’t need to predict Monday.
I need the market to show its hand.
@LarkDavis The real race isn't who files first.
It's who gets the SEC and CFTC to agree first.
Two regulators, one product. That's historically where good ideas go to wait.
Whoever clears it wins the retail leverage flow for years.