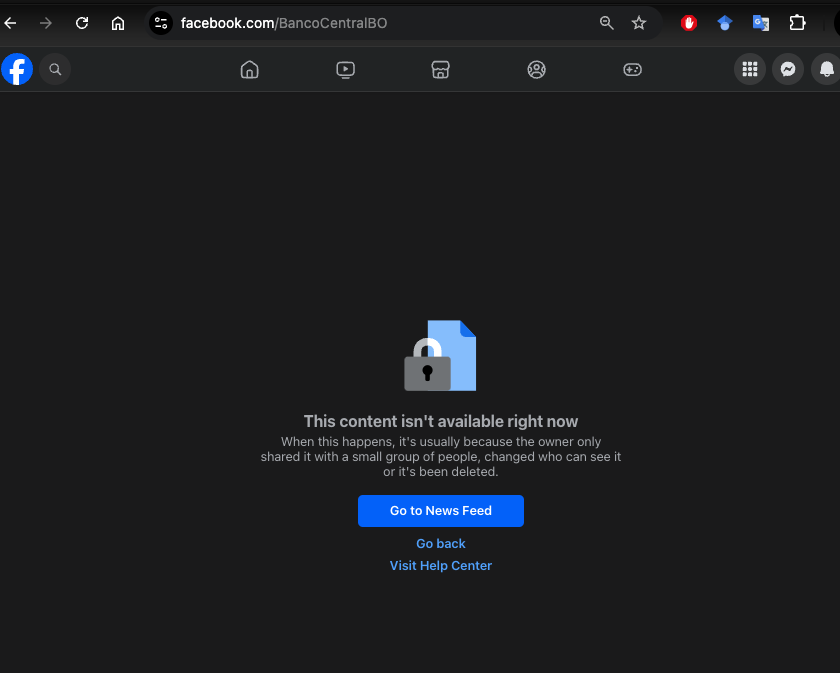
🧵El @BancoCentralBO me bloqueó en Facebook. Esto por decir unas cuantas verdades en el post donde su presidente Edwin Rojas, intentaba, sin éxito, mostrar que la situación sobre las Reservas Internacionales Netas estaba ya controlada: #Bolivia es el país de las maravillas 1/n
I am always amazed that most people saving for retirement (or designing optimal Social Security systems) rarely take sequencing risk seriously. Simply put, sequencing risk is the risk associated with the order in which returns arrive over one’s lifetime.
Sequencing risk hits you twice: while you are working and accumulating wealth, and again while you are retired and drawing it down. Today, I will focus on the first part. The retirement phase warrants its own discussion, and I will address it in a subsequent post.
Let me walk you through an exercise I ran yesterday using actual historical U.S. stock market data from the past 80 years to illustrate how important sequencing risk is.
I took the annual total returns of the S&P 500 (including reinvested dividends) from 1945 to 2024. The source is the dataset maintained by Aswath Damodaran at NYU Stern, a standard reference for long-run U.S. equity returns. I then deflated each year’s nominal return by the CPI-U inflation rate published by the Bureau of Labor Statistics to obtain real total returns, i.e., returns in constant purchasing power.
Over this 80-year period, the S&P 500 delivered a geometric mean real total return of about 7.5% per year. That is an impressive number. But this average return masks a lot.
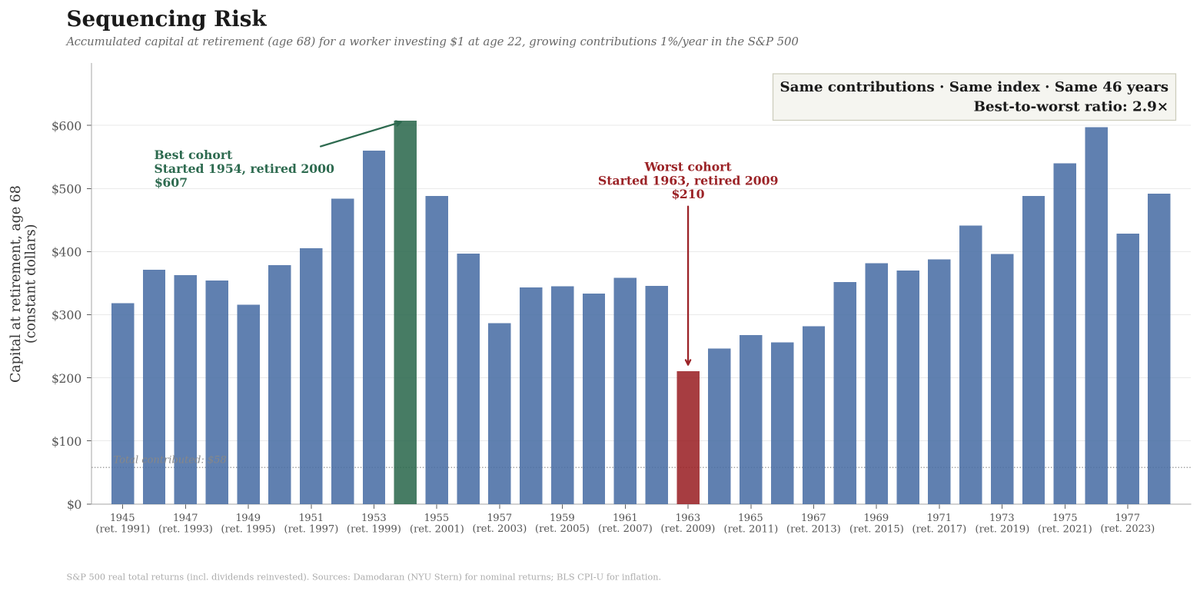
Imagine a worker who starts investing at age 22 and retires at age 68. That gives them 46 years of contributions. In their first year, they contribute $1. Each subsequent year, they increase their contribution by 1% (roughly keeping pace with real wage growth). Every dollar is invested in the S&P 500. They never touch the money until retirement. No panic selling, no market timing, no strategy switching (and no management fees!). Textbook investing and waiting.
I ran this exercise for every possible cohort for which the data allow. The first cohort starts investing in 1945 and retires in 1991. The second starts in 1946 and retires in 1992. And so on, all the way to the last cohort, which starts in 1978 and retires in 2024. This yields 34 cohorts, each investing for 46 years, making the same contributions and investing in the same index. The only difference among them is which 46-year slice of historical returns they happen to live through.
The most fortunate cohort, the one that started investing in 1954 and retired in 2000, had $607 on the day of retirement (remember, all in real terms), with a real annual return of 8.82%. The unluckiest cohort, the one that started in 1963 and retired in 2009, accumulated $210, with a real annual return of 4.83%. Same contributions. Same index. Same strategy. Same investment horizon. Yet the luckiest retiree ended up with 2.9 times more wealth than the unluckiest.
Why? The 1954 cohort had a spectacular final decade. The late 1990s delivered some of the best equity returns in American history, and those returns compounded on a large portfolio built over decades. They retired at the peak, at the end of 1999, before the dot-com crash. The 1963 cohort was not so fortunate. They spent their last working years running straight into the 2008 financial crisis. The S&P 500 lost over 36% in real terms in 2008 alone. That loss hit their portfolio when it was at its largest, right before retirement, with no time left to recover.
Clearly, sequencing risk is not about the average return. Both the 1954 and 1963 cohorts experienced roughly similar average returns over their 46-year periods. The difference is when the good and bad years occurred. For the 1954 cohort, the bad years came early (when the portfolio was small) and the good years came late (when the portfolio was large). For the 1963 cohort, the opposite was true.
In fact, sequencing risk is even worse because poor returns in the stock market are correlated with weak labor markets: you have a much higher probability of losing your job (or seeing your wage income fall) precisely when the market is doing poorly, preventing you from saving when prices are low and equities are most attractive. However, let me set that point aside today to simplify the exposition.
The standard response of the financial planning industry to sequencing risk is the so-called glide path. The idea is simple: when you are young, you hold mostly equities. As you age, you gradually shift toward bonds. By the time you are near retirement, most of your portfolio is in bonds. A common implementation is a linear rule: start with 90% in stocks at age 22 and reduce the equity share steadily until you reach 20% in stocks at age 68. This is roughly what target-date retirement funds do.
The logic is sound in principle. You reduce your exposure to equities precisely when a crash would hurt you most. If 2008 happens when you are 65 and 80% of your portfolio is in bonds, the equity crash barely affects you.
I applied this glide path strategy to the same 34 cohorts, using historical real returns on the S&P 500 for the equity portion and real returns on 10-year U.S. Treasury bonds (from Damodaran) for the bond portion. Each year, the portfolio is rebalanced to the glide path weights.
The glide path does what it is intended to do: it reduces dispersion. The gap between the best and worst cohorts narrows from 2.9x under pure equities ($607 vs. $210) to 1.6x under the glide path ($292 vs. $178), but so does the upside. The best equity cohort (1954–2000) earned a geometric mean real return of 8.82% per year. The best glide path cohort (1975–2021) earned 6.59%. That is a 2.2 percentage point gap. Over 46 years of compounding, a 2.2 percentage-point annual yield yields an enormous difference in terminal wealth: the best glide-path outcome ($292) is less than half the best equity outcome ($607).
In other words, the cost of this insurance is substantial. In fact, the median cohort ends up meaningfully poorer under the glide path than under 100% equities. You are not trimming a bit of upside. You are forgoing a substantial share of your expected wealth at retirement.
This should not be surprising. Over the long run, equities have outperformed bonds by a wide margin. The equity risk premium is one of the most robust facts in finance. Every year you shift a dollar from stocks to bonds, you accept a lower expected return. Do this for 25 years of your career (roughly the back half, when the glide path has you increasingly in bonds), and the cumulative cost from foregone compounding is very large.
But the part that makes me most uncomfortable with the standard glide path advice is that bonds are not safe. People hear “bonds” and think “safe.” They are not. Bonds carry two risks that are easy to forget when inflation is low and interest rates are stable.
The first is inflation risk. A conventional bond pays you a fixed nominal coupon (yes, there are TIPS and similar instruments, but they have their own problems, so let me skip them for today). If inflation rises above the market’s expectations when the bond was issued, the real value of those payments declines. The cohorts that retired through the 1970s learned this the hard way. In the data, the real return on 10-year Treasuries was negative in multiple years during the 1970s.
The second is interest rate risk. When interest rates rise, the market value of existing bonds declines. The longer the maturity of your bond, the larger the hit. In 2022, the Bloomberg U.S. Aggregate Bond Index declined by approximately 19% in real terms. If you were 65 and had just shifted most of your portfolio into bonds following the standard glide path advice, you would have lost nearly a fifth of your “safe” allocation in a single year.
And here is the real sting of 2022: equities fell, too. The S&P 500 lost about 24.5% in real terms that year. The glide path assumes bonds will be there to cushion you when stocks fall. In 2022, both fell together. The cushion was not there. This is not some once-in-a-century event. Stocks and bonds have moved in the same direction before: the 1940s, the 1970s, and in 2022. The negative correlation between stocks and bonds that many investors take for granted is a feature of the disinflationary period from roughly 1982 to 2020. It is not a law of nature.
Let me be clear: I am not saying the glide path is wrong. For many people, it is the right choice. If a 30% equity crash near retirement would force you to sell assets at the worst possible time to cover living expenses, the insurance is worth paying for.
However, you should know what you are paying. The glide path (or variations of it that I am skipping in the interest of space) is not free. It entails substantial costs in expected returns. Worse, the insurance itself can fail. Bonds can lose money in real terms for extended periods. Bonds can fall at the same time as equities. The glide path reduces sequencing risk. It does not eliminate it. It also introduces risks of its own.
The deeper lesson from this exercise is that a substantial part of your retirement outcome depends on when you are born. You can do everything right (save diligently from your first paycheck, invest consistently, stay the course through every crash, never panic sell) and still end up with vastly different results than someone who did the same thing a decade earlier or later. The 1963 cohort did nothing wrong. They just had the misfortune of turning 68 in 2009.
No allocation strategy eliminates this. Even under the glide path, the best cohort ends up with substantially more than the worst. Sequencing risk is, to a significant extent, a matter of luck.
Next time: what happens when sequencing risk hits you in retirement, when you are drawing down instead of building up. The math there is, if anything, even more unforgiving.
No volvía a Santa Cruz, Bolivia hace algo más de 2 años. Algunas primeras impresiones superficiales: todo muy similar salvo algunos nuevos edificios terminando de construirse. Calles en peor estado y muy poco tráfico. La gente más cansada. También varias 4x4 del año. Curioso.
Muchos lectores han respondido a mi entrada de ayer sobre el gasto social y los impuestos por edad diciendo: “Esto es exactamente lo que pasa con un sistema de reparto; no me sorprende ni me preocupa”.
Sí, es cierto que este es el patrón básico en un Estado del bienestar moderno, pero esa respuesta confunde un patrón cualitativo (contribuyes al Estado del bienestar durante tus años de trabajo y recibes cuando eres niño y cuando eres mayor) con un patrón cuantitativo (cuánta redistribución realizamos).
Comer un plátano al día es una buena idea para la mayoría de las personas: aporta potasio, fibra y vitaminas. Comer 100 plátanos al día es una idea horrorosa.
Con la redistribución por edad ocurre lo mismo: una cantidad razonable de redistribución bajo un sistema de seguridad social de reparto es una idea magnífica; una cantidad excesiva es una idea horrorosa.
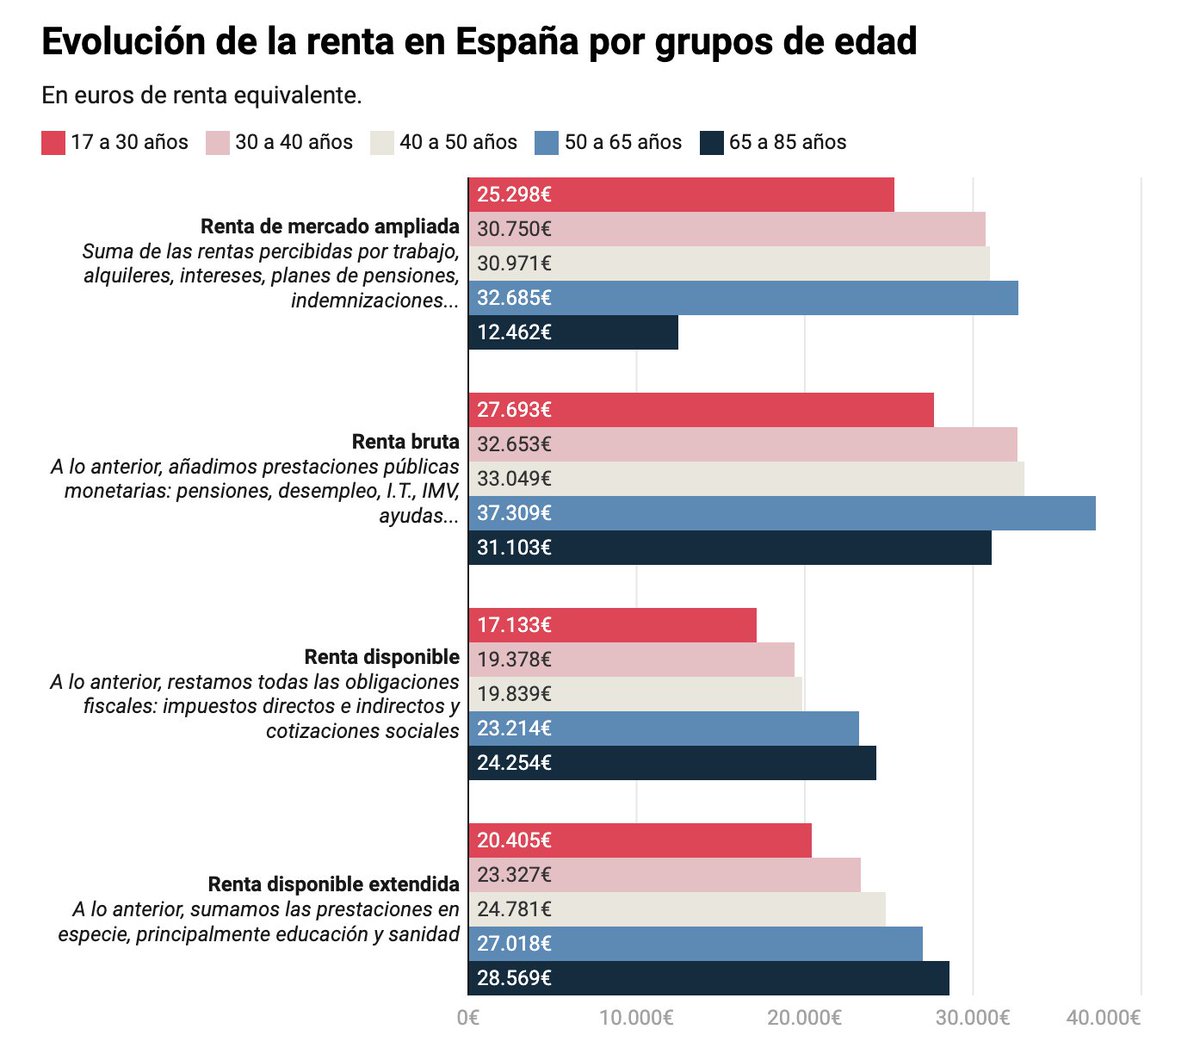
En el gráfico que incluyo, elaborado para un artículo que escribí con @Jongonzlz, se observa que el Estado del bienestar en España redistribuye tanto a los mayores de 65 años que los convierte en el grupo con mayor renta disponible extendida (después de impuestos y transferencias), con unos 5.000 euros más que las personas de 30 a 40 años.
Este resultado carece por completo de justificación y señalarlo no implica enfrentar a una generación con otra. Es simplemente enfatizar que tenemos un problema de primer orden de justicia social en España.
¿Cuál es el origen del problema? Que, con el sistema actual, el valor presente descontado de las pensiones contributivas es entre un 50% y un 70% superior al valor presente descontado de las cotizaciones sociales. (El tipo de interés adecuado para estos cálculos es el mismo que el crecimiento del PIB real).
Y sí, tenemos un sistema de reparto, no de capitalización, pero eso no significa que estos cálculos actuariales no deban hacerse. Solo cuando existe equivalencia en valor presente entre pensiones contributivas y cotizaciones sociales —como ocurre en Suecia o en muchos otros países donde políticos y votantes se toman estas cuestiones con la seriedad que merecen— tenemos un sistema sostenible.
Soy muy cuidadoso de no incluir en este cálculo las pensiones no contributivas ni todas las demás prestaciones sociales complementarias.
Así que sentémonos a pensar en cómo podemos diseñar un Estado del bienestar sostenible y justo, no simplemente aceptar lo que tenemos ahora.
Super interesting!
"The Impact of Fiscal Policy on Inflation Expectations" by Francisco Arizala, Santiago Bazdresch, Tomohide Mineyama, and Shiqing Hua.
"This paper analyzes the impact of fiscal policy on inflation expectations across a large sample of advanced economies (AEs) and emerging market economies (EMs). We identify episodes of significant fiscal adjustment using both quantitative thresholds and a narrative approach and find that such episodes are associated with statistically significant changes in inflation expectations in EMs while the responses are muted in AEs. We also document that the relationship between fiscal policy and inflation expectations is more pronounced in high-inflation environments and under weak fiscal positions."
https://t.co/TrdsX34J73
Los masistas siendo masistas. @LuchoXBolivia y Montenegro, de los peores de la historia, son hombres pequeños y lamentables. Cuánto daño le hicieron al país.
Hoy asumimos la conducción del Ministerio de Economía y nos encontramos con oficinas vacías, sin documentación ni respaldo alguno. Después de 20 años de gestión, no quedó nada. Este nivel de irresponsabilidad demuestra cómo se administró el país. No permitirán el boicot: sabemos qué hacer y cómo reconstruir.
@g_espinoza Felicidades Gabriel, hermoso reto el de volver las instituciones económicas confiables y transparentes otra vez: MEFP, INE, BCB, ASFI. Éxitos!
Una de las cosas buenas del nuevo gobierno en #Bolivia es que ahora nos podremos informar viendo las páginas de las instituciones públicas y ministerios. La propaganda y los guerreros digitales eran insufribles.
He sido crítico de Lara por su populismo y sus formas. Sin embargo, el discurso de su juramento me ha sorprendido: el poncho y la corbata, eso es lo que el país necesita. Ojalá logren construir esa unidad pero bajo la verdad que decía Paz, y eso implica no más bonos ni subsidios.
This (I claim) is how we should present the NK model to students and policy makers.
Not with three equations, but with two. An aggregate supply relationship, the NKPC, and an aggregate demand relationship, the monetary reaction function.
Effectively, the central bank directly chooses inflation, as a function of the output gap.
There are many ways by which such a reaction function can be implemented (including via real rate rules), but these details are perhaps not so important.
Importantly, note that these two equations are independent of the degree of household heterogeneity. This is at once a RANK model, a TANK model and a HANK model!
Let me explain why I believe modern economics is such a powerful tool for understanding the world. I’ll do this by discussing a great paper by Simone Cerreia-Vioglio, @UncertainLars, Fabio Maccheroni, and Massimo Marinacci, “Making Decisions Under Model Misspecification,” published in the Review of Economic Studies a few months ago.
Imagine I want to drive from UC San Diego to UCLA, but I’ve never driven that route before. I need to build a “model of the world” to guide me, which we usually call a map. Maps are simplified representations of reality. They can’t include every detail if they’re to be useful. Borges, in his short story On Exactitude in Science, makes this point beautifully. (In practice, I don’t draw the map myself—I use an app—but someone still had to make it.)
Because maps simplify, I can’t fully rely on them. Maybe last night’s storm knocked down a tree and closed a street, or there’s construction and the ramp off the highway in LA is shut down.
This uncertainty matters. Suppose I’m driving to UCLA for an important talk at 11 a.m. If the ramp is closed, I might need 15 extra minutes. When should I set my alarm to arrive on time, while still getting enough sleep to give a good talk?
The problem is that I can’t assign precise probabilities to all these contingencies. How likely is the fallen tree? Or new roadwork? Even the best traffic apps can’t capture every disruption, and some might happen after I’ve already left.
In economic terms, my “model of the world” (the map) is misspecified—and no matter how hard I try, I can’t fully fix that.
But sitting down and crying about misspecification doesn’t answer my basic question: when do I set the alarm? Too early, and I’m exhausted. Too late, and I’m late.
Simone and his co-authors offer a way to think about this. They start from the idea that we often hold several structured models of an economic phenomenon, grounded in theory. For example, a central bank might use a standard New Keynesian model and a search-and-matching model of money.
Yet, aware that each model is misspecified by design, the bank adds a protective belt of unstructured models—statistical constructs that help it gauge the consequences of misspecification.
The beauty of the paper is that it provides an axiomatic foundation for this protective belt (and even generalizes it to include a Bayesian approach). It shows that if a decision-maker’s preferences meet certain conditions —reflecting both rational and behavioral features— then those preferences can be represented by an augmented utility function that formally accounts for misspecification.
Crucially, we don’t assume that augmented utility function; we derive it. We start with general, plausible properties of preferences and prove that they imply such a representation.
That’s real progress. Instead of writing endless critiques of expected utility or rational expectations (as many have done for decades, with little to show), we now have a formal way to reason about misspecification—precise definitions, clear boundaries of validity, and awareness of what we still don’t know.
Take, for instance, a brilliant Penn graduate student on the market, Alfonso Maselli
https://t.co/rl2gu95V7t
His job-market paper pushes this frontier further. He studies cases where a decision-maker not only faces model misspecification but is also unsure which model best fits the data and can’t assign probabilities to them—what we call model ambiguity. In my example, the central bank is unsure whether the New Keynesian or the search-and-matching model fits better, and it worries that both might be incorrect.
If you read Simone et al. or Alfonso’s paper, you’ll see how misguided—and, frankly, cartoonish—many of the recent criticisms of economics on X have been.
First: the idea that economists don’t understand math or have “physics envy.” The math in these papers is subtle and advanced—utterly different from what physicists do (neither better nor worse, just distinct). An engineer transitioning into economics would find these tools unfamiliar.
Second: claims of ideological bias are unfounded. I have no idea about the political views of the authors, and I’d be surprised if anyone could infer them from the analysis—beyond vague guesses about typical academics.
Third: This has almost nothing to do with what one learns as an undergraduate, or even in first-year graduate school. If your knowledge of economics stops at an intro textbook, it’s best not to pontificate on the field’s frontiers.
Fourth: Is this science? Debating that word’s boundaries is pointless; every definition of “science” breaks down somewhere.
The Germans solved this long ago with the idea of Wissenschaft—the systematic pursuit of knowledge, whether of nature, society, or the humanities. By that measure, modern mainstream economics is clearly a Wissenschaft: a disciplined, cumulative, and highly useful effort to understand how the world works. Simone and his co-authors have demonstrated that beyond any reasonable doubt.
Una consecuencia de la inflación en Bolivia: cuando se expresan en términos reales, la cartera de créditos y las obligaciones con el público se contraen. Nada nuevo bajo el sol, pasó en los años 78-82. Solución? Liberar las tasas y quitar cupos de cartera. Prepararse para la mora
Wow, super interesting!
"Expectations Matter: The New Causal Macroeconomics of Surveys and Experiments: What people believe about the economy—and why it matters" by Olivier Coibion and Yuriy Gorodnichenko.
"How do expectations about the future influence economic behavior? For decades, economists have known that beliefs play a central role—from how much households spend, to how firms set prices, to how central banks design policy. But figuring out exactly how expectations affect decisions has been one of the field’s most persistent empirical challenges."
Princeton University Press:
https://t.co/Cc7f2XW1qs
Amazon:
https://t.co/s7l8vqYWij
This looks like a must-read!
"Inflation and monetary policy in medium-sized New Keynesian DSGE models" by Günter Coenen, Falk Mazelis, Roberto Motto, Annukka Ristiniemi, Frank Smets, Anders Warne, and Raf Wouters.
"The paper takes stock of the evolution of medium-sized New Keynesian Dynamic Stochastic General Equilibrium (DSGE) models, which currently constitute the workhorse macroeconomic models used in central banks and academia. It focuses on how they can help analyse inflation dynamics, monetary transmission, and policy actions."
https://t.co/cIiiookmzT
Por fin, Rojas Ulo y Montenegro deberán responder ante la justicia por el daño económico que le han ocasionado a todos los bolivianos, producto de su incompetencia e irresponsabilidad.
La denuncia presentada por Gregorio Gómez Mamani, dirigente alteño, busca esclarecer la situación de las Reservas de Bolivia en oro
#Unitel#Bolivia https://t.co/11vODTWQSW
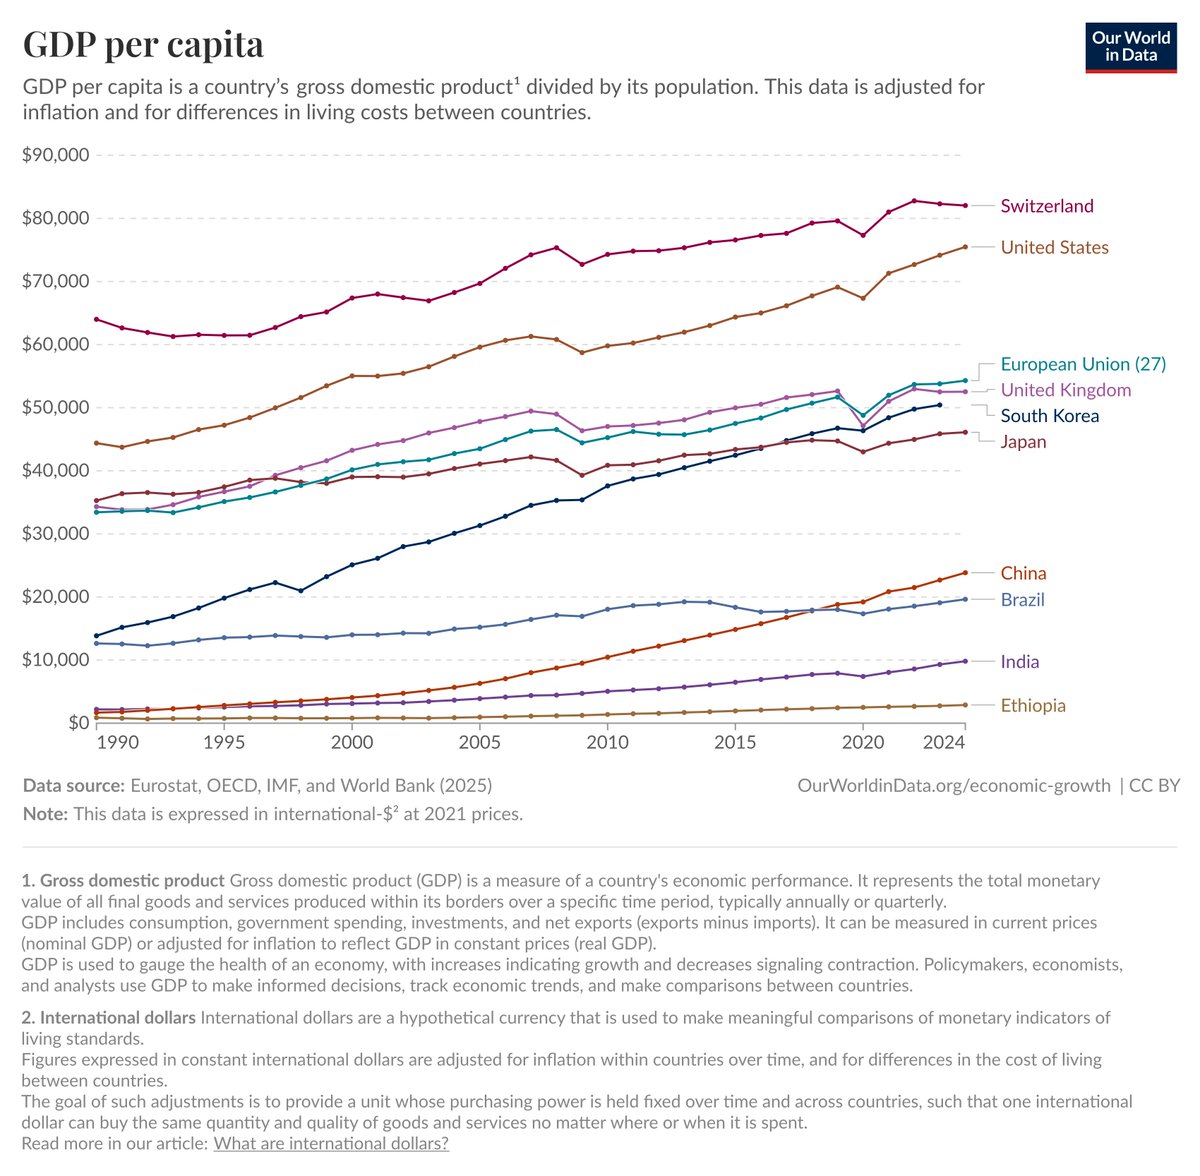
Olivier is right. Frontier growth is vital, somewhere in the world. But for every country with GDP per capita below $70,000, the challenge is to catch up the level not to innovate. Be only as dysfunctional as the US. And gains are enormous. Perhaps someday there will be a Nobel for catch-up growth, though it's mostly just "read Adam Smith."