We're hiring @rstudio for roles in developer relations!
📗 Interested in coding, education & advocacy?
🚀 Come work with us & help users learn and flourish!
* Developer Educator - #tidyverse package development
* Developer Advocate - Quarto #quartopub
https://t.co/2rdWStPW8O
Next #rstats meetup is on Thursday, Sept 29th! JD Long (@CMastication) will be giving a talk on reprex!
💻 Fully virtual
RSVP now➡ https://t.co/8ijt4PNYzf
I hate it when I can't customize each part of my ggplot. Usually, that happens when an aesthetic is not vectorized.
Luckily, there's an easy workaround. Here's how. 🧵 #rstats
We are excited that @kate_c_dodds is presenting this workshop. Kate is part of the @mqnatsci Benthic Ecology lab & works on the Living Seawalls project. She was new to R at the start of her PhD; now it's an irreplaceable tool for her stats & data wrangling #rstats#WomenInSTEM
Has learning R been on your to do list since forever?? Now is your chance - join us for a @Rusers_MQ beginner’s blitz session of R and #RStudio next week.
1:30-3:30pm Fri 16 Sept.
All welcome, no previous R experience necessary.
Register here https://t.co/fn4Wdplxgv
#rstats
The resources for this workshop will be available soon from https://t.co/wVONVX3FX2. If you want to code along with us please have R & RStudio installed before the workshop. Instructions for installation are here: https://t.co/wSVtLqiYz6
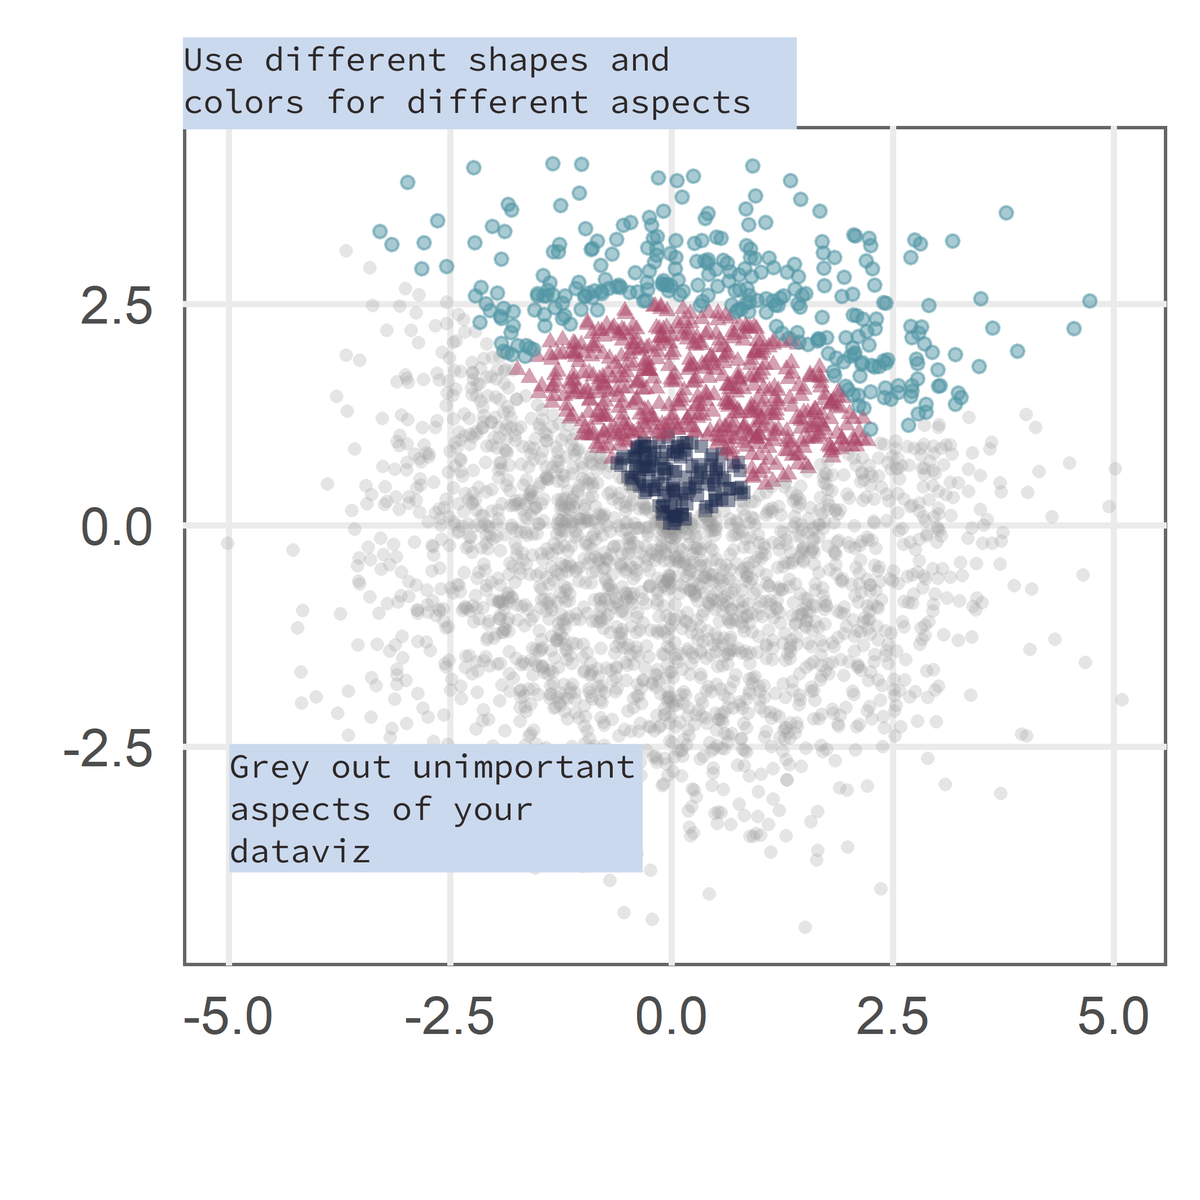
Your dataviz can easily drill down into what's important with conditional formatting.
#rstats has a powerful combo to do that:
1️⃣ case_when() or if_else()
2️⃣ scale_*_identity()
Here's a demo how you can change color, shapes or whatever based on any condition you like
#dataviz
If you need a refresher (or intro) on the processing and modeling of text data, "Supervised Machine Learning for Text Analysis in R" is an excellent read and applied book to follow at your own pace using the {tidymodels} framework 🤌🚀. Better yet, the entire eBook is free online
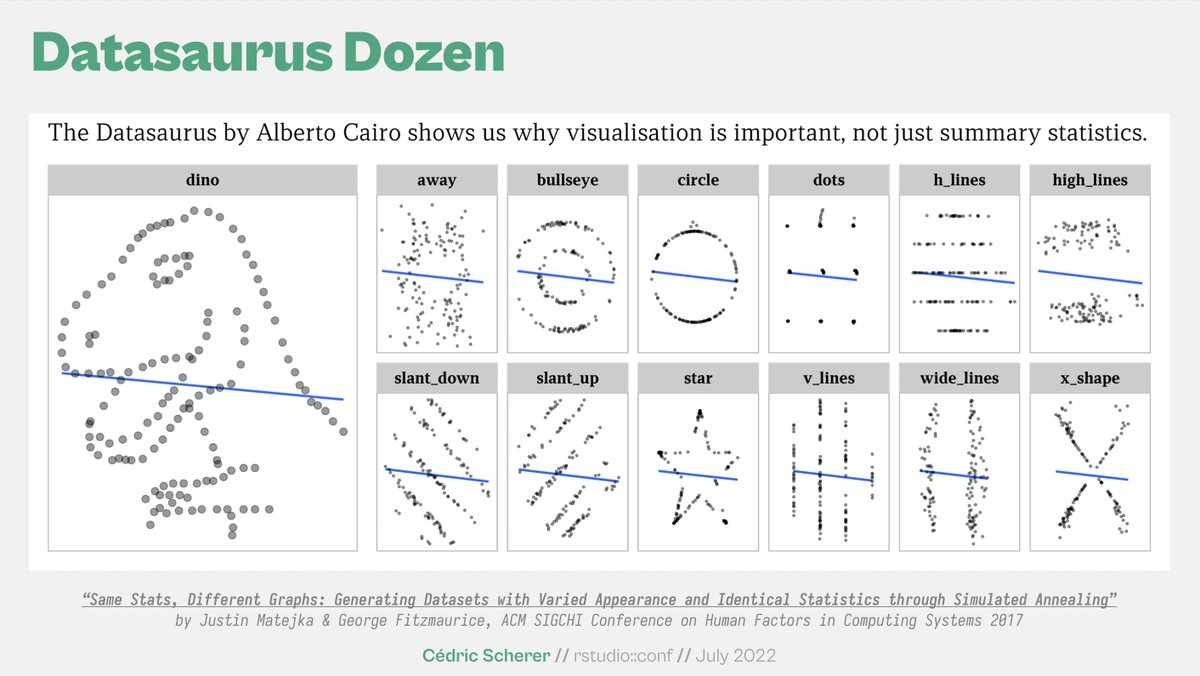
📊 Do you want to create engaging and complex data visualizations in R? @CedScherer has shared all the material from his conference in #rstudioconf2022 about the ggplot2 graphics library 👉 https://t.co/WMR4rvfF6o #DataScience#dataviz#RStats
Excellent talk this week in @MQMathsStats. Fascinating to hear about apophenia (humans seeing patterns in random data) & how we can test if we’re falling prey to this using #rstats nullabor 📦 to generate a lineup of plots with part of the data randomised @MQSciEng
Is what you see really there? Prof. Dianne Cook explains apophenia and how to determine if a data set actually exhibits the structure that we (may want to) see. Thanks for a fantastic talk! @MQPhysAstro @fse101MQ@MQSciEng @SamuelMu11er
Today's #rstats cheatsheet: Machine Learning Modelling in R
Download: https://t.co/nLBsnMUCi0 Learning Modelling in R.pdf
See more: https://t.co/KgJ4eggU4l
Contribute your own: https://t.co/KLVFg0ougL