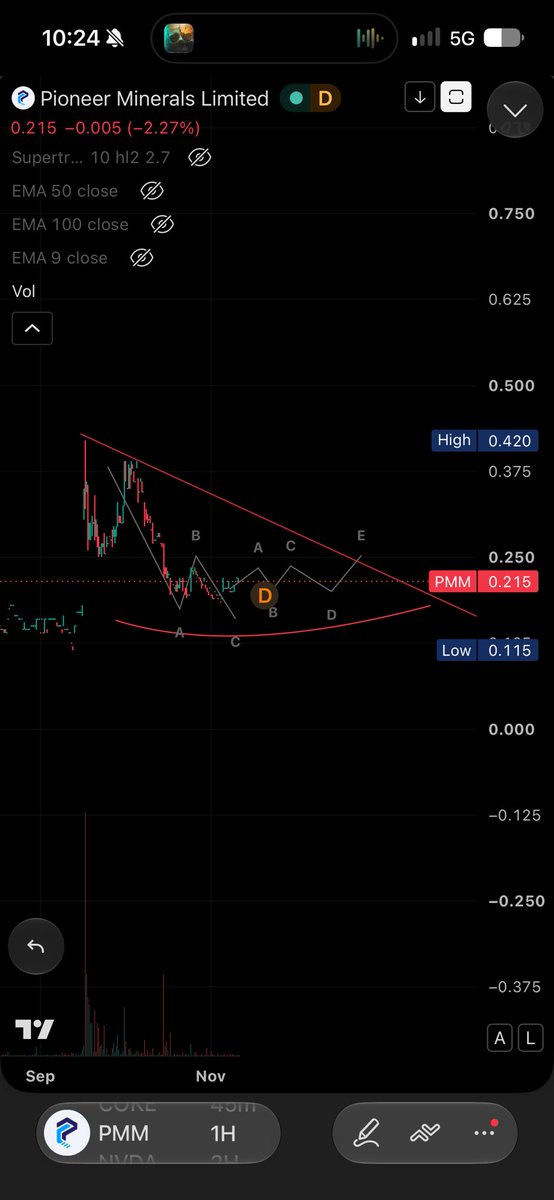
Could be one of the best buys if it stays on this base for longer . I’m slowly starting to add , but in this market you really need a base or 100 percent everything goes lower . $PMM #PMM
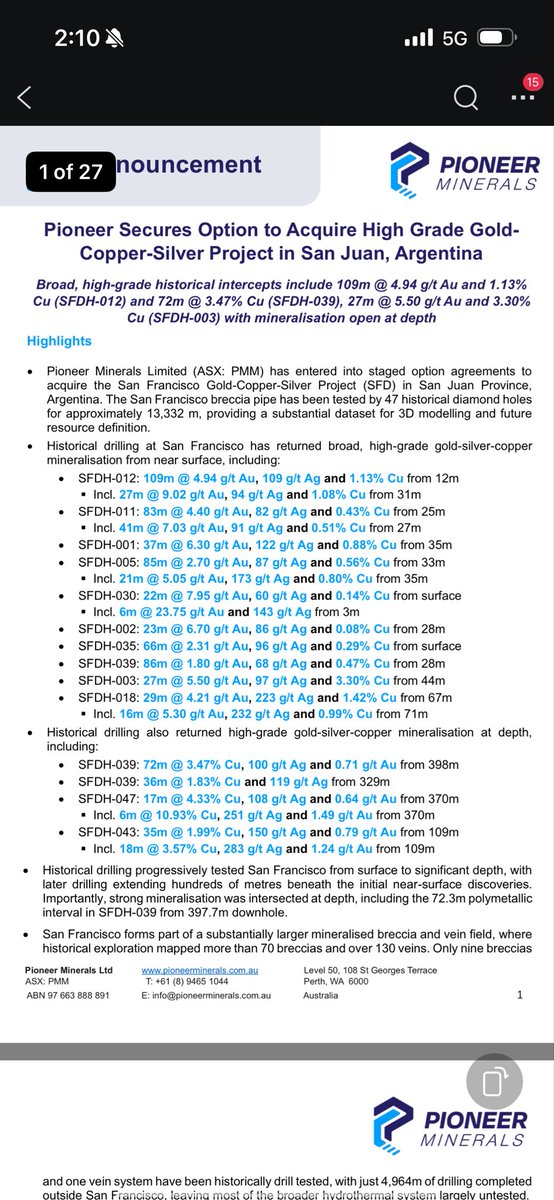
@steepclimber Every explorer is high risk in the spec sector. lol . Looks good value to me when it sets up . Some amazing historical drills and for less than 15m mc
Has to be a buying opportunity surely . I added more pre markets but this lower trend line is a magnet 🧲 now . The smarter thing to do is not dip buy but wait for some reversal shape , break up of the hourly chart . Since this price is always the same as dip buying . At best a chart will move sideways and the break price is close to the dip price .
Also Daily RSi break up too. But if this lower trendline gets hit it has to be a buying opportunity
$BMM $7M MC💥
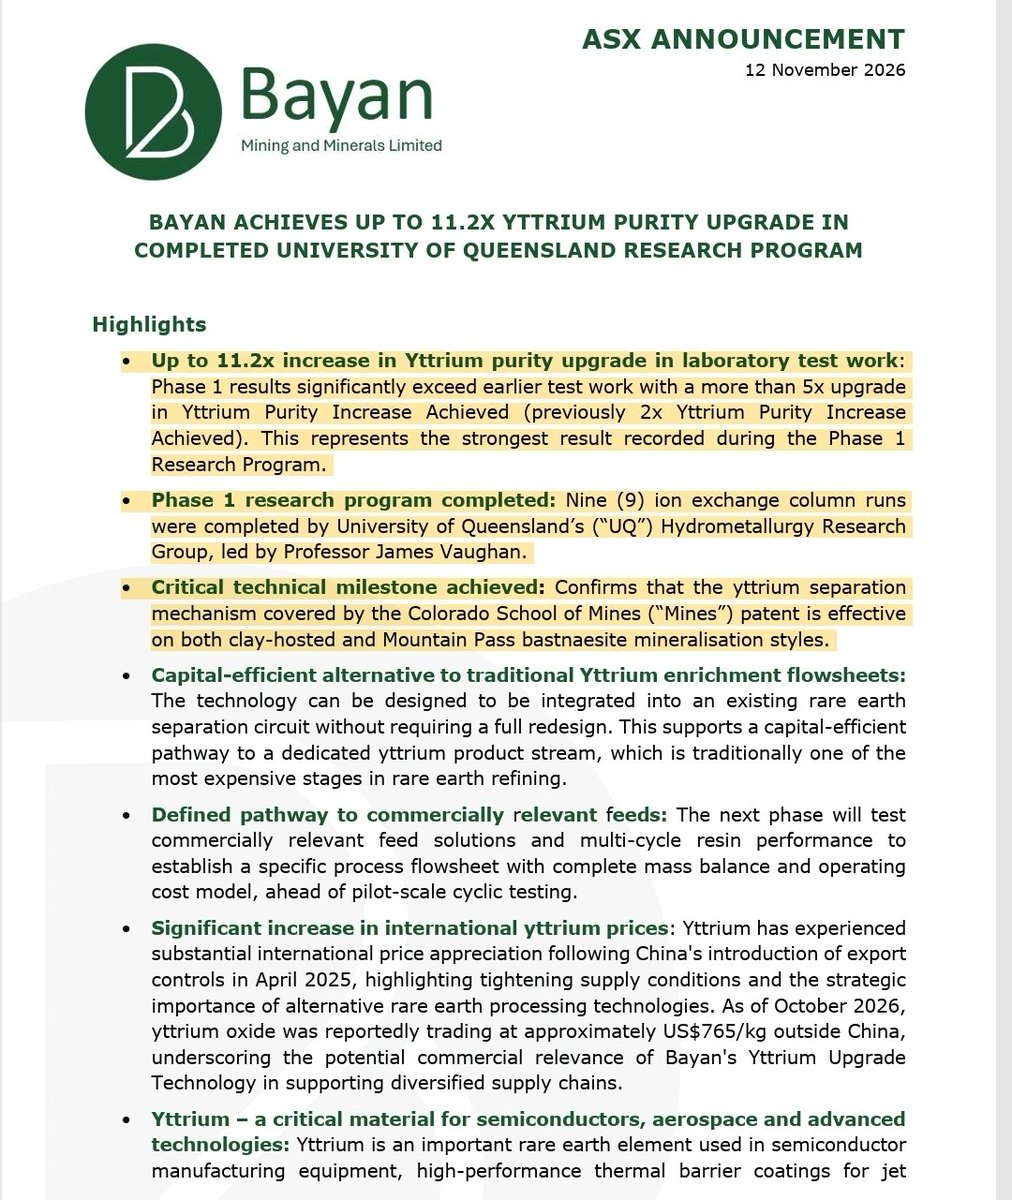
#ASX#REE#RareEarths#ProcessingTech NEWS
PHASE 1 RESEARCH PROGRAM COMPLETED:
Nine ion exchange column runs were completed by University of Queensland
✴️UP TO 11.2x INCREASE IN #YTTRIUM PURITY upgrade in laboratory test work, Phase 1 results significantly exceed earlier test work with a more than 5x upgrade in Yttrium Purity Increase Achieved✴️
$MTM $ION $IXR
@Dimitrios_1963 I’m actually waiting for another wave down to go super large ( for me ) and obvs wil have confirmation of a up move from a decent 5 wave structure down then a break of the primary up trend . Feels like a 200 percent trade and one of the best you can get
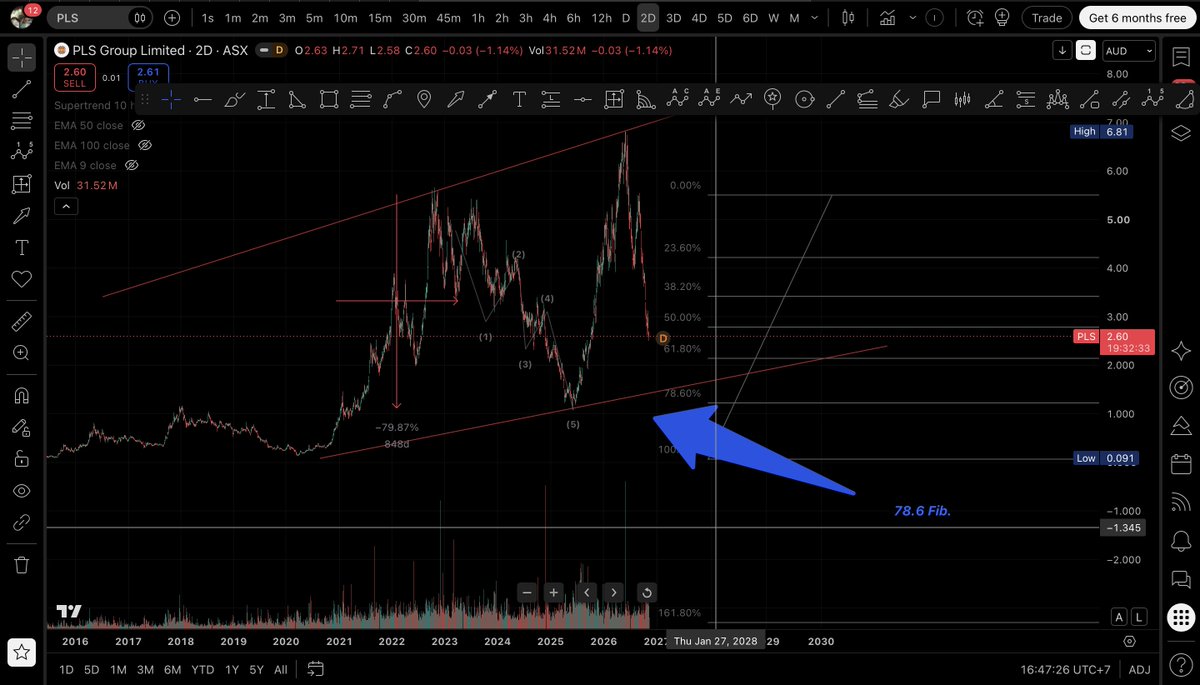
Wave 4 bounce has started , Heavy accumulation zone end of wave five. Break up of up sloping Red line voids 5 wave structure. Then it was just a ABC down $PLS
How can someone buy the bottom or find a good entry for $PLS?
IMO, when the time is right, this could be a very good trade. I will personally be applying six figures for a potential 2x win here.
I have a few buying models. First of all, history doesn’t always repeat, but you would be a fool not to respect it. Until it doesn’t happen, you have to follow it.
We know that in the past, $PLS has had a five-wave corrective breakdown with sub-waves. We know it declined by 79% while reverting back to the 78.6 Fibonacci level.
I will be applying my first buy at the start of Wave 4.
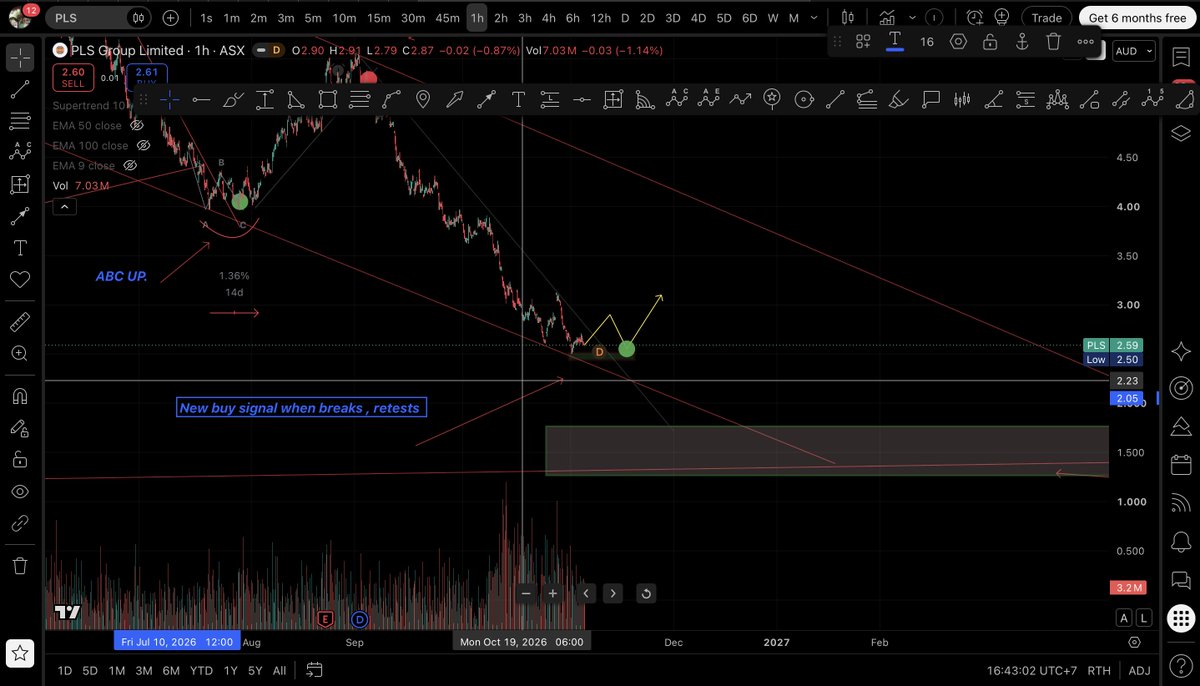
The one-hour chart in the past showed the reversal on a break of the one-hour trendline, followed by a retest and a double bottom. (ABC up ) This would provide a high-probability long entry for the next wave up.
I also think the bottom will be somewhere between $1.50 and $1.70, with the yellow line representing a strong accumulation/DCA zone at $2.09. And the Green box a calculated bottom.
Price action always changes, and a breakout above its primary descending trendline is the only event that could invalidate this thesis and signal a faster move upwards. ( break up or red line )
The corresponding bottom trendline also aligns with an 80% pullback and the projected bottom of Wave 5.
I also have confirmation for the trend reversal being
1- Break up of Daily RSI
2-Break up of 5D super trend ( every time in the past this break was confirmation of the reversal )
3- Cross up of 100 day EMA to 50 day EMA
4- Break of the primary down sloping trend line .
Once these happen its heavy buying .