Gandhiji ne baccha liya aaj toh!
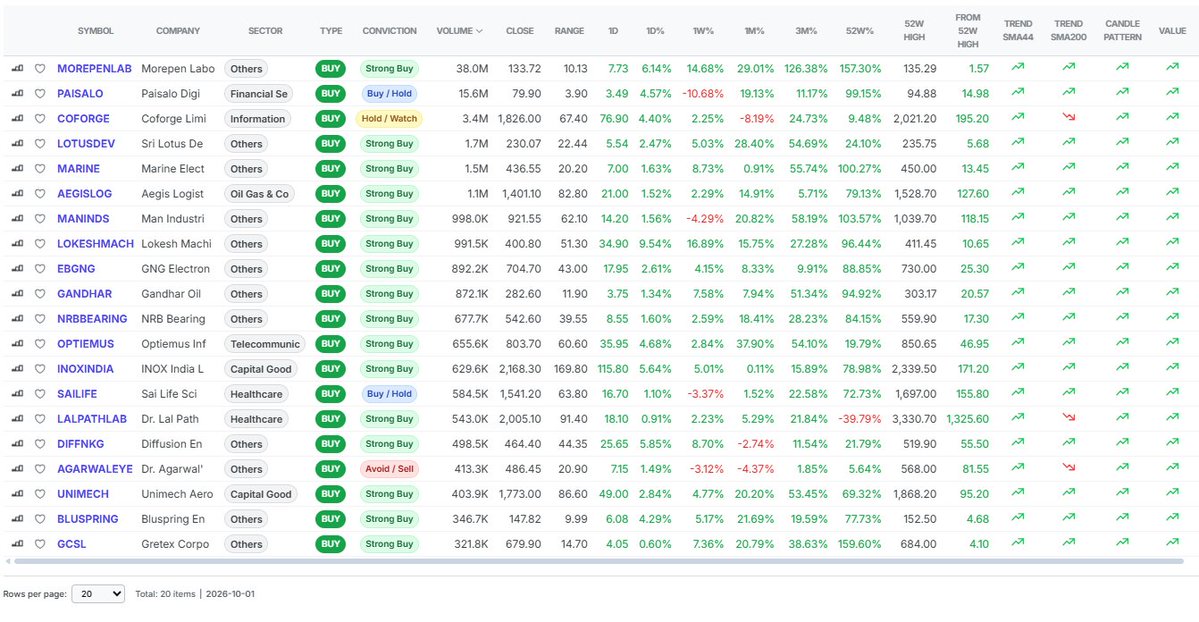
Despite over all market going down, wars, oil prices surge, there are companies which are super bullish. I guess it's time to look outside the Large caps.
Wondering what is driving this companies up?
Link to filter: https://t.co/g6SQqoSKaB
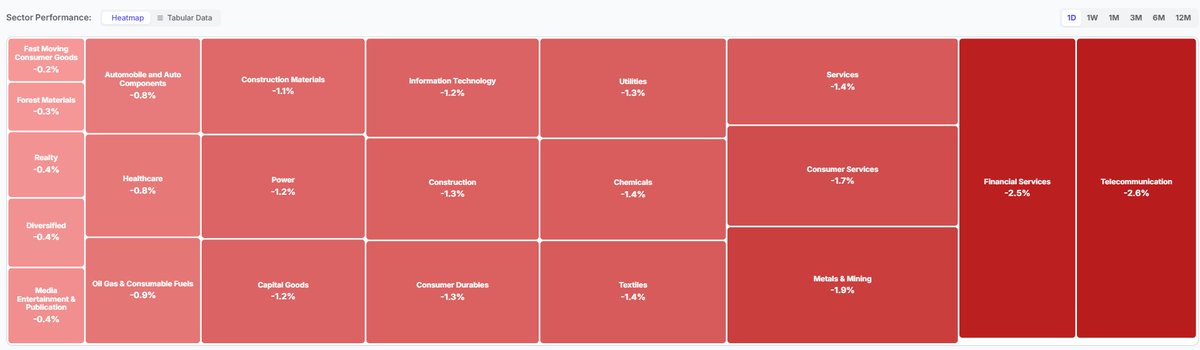
This is how my trading board looks like . I hope the market trend changes soon. 75% of stocks are in red. What should I do ? Sell off all with heavy loss ?
Stock Scanner feedback required for https://t.co/mHiK20OcJ4
I need some volenteers who could spare some time evaluating the stock scanner and provide some feedback and more features that could be added.
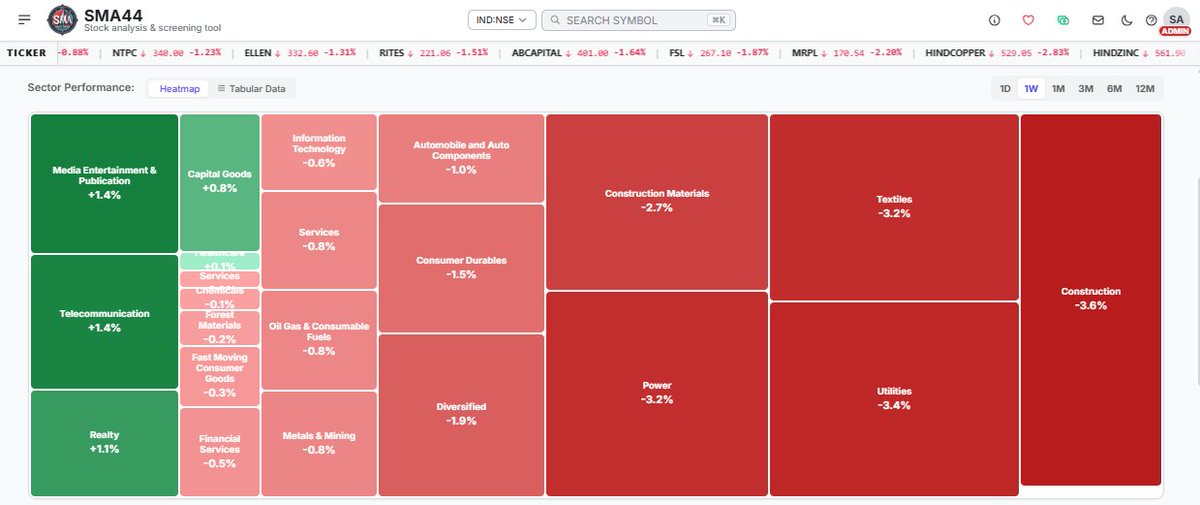
Are you trading according to the sectors?
Sectors Media Entertainment & Publication, Telecommunication & Realty has been really doing well this week.
Always trade according to active bullish sectors to be a succesful trader!
For the last 12 months Telecommunication Sector has be going really strong. Especially HFCL and STLTECH is really giving excellent returns. Hope other sectors also recover soon.
Why have traders stop trading in Indian stock market? Is it the
1.taxes
2.less profits
3.Rupee depreciation or?
What is your take?
Any suggestions on how are you doing?
This captures the exact candle where the price closes above the 200-period moving average. Because it uses crosses above, it filters out stocks that have been above the 200 SMA for months, focusing instead only on the day-one breakout event.
200 SMA Regime Shift https://t.co/T2F9EIZdsp via @YouTube
The Institutional Line-in-the-Sand Breakout (200 SMA Regime Shift)
This query triggers the exact day an asset transitions from a long-term bear market or a prolonged base into a major macro uptrend.
Try now
200 SMA Regime Shift https://t.co/T2F9EIZdsp via @YouTube
The Institutional Line-in-the-Sand Breakout (200 SMA Regime Shift)
This query triggers the exact day an asset transitions from a long-term bear market or a prolonged base into a major macro uptrend.
Try now
Short Term Bullish Momentum Crossover 9 & 21 EMA https://t.co/XwQU2ZrAZi via @YouTube
Only bullish trades for US & Indian exchanges
it looks for stocks where EMA 9 crosses above EMA 21
and Close is above EMA 9
simple query no complications in understanding.
Short Term Bullish Momentum Crossover 9 & 21 EMA https://t.co/XwQU2ZrAZi via @YouTube
Only bullish trades for US & Indian exchanges
it looks for stocks where EMA 9 crosses above EMA 21
and Close is above EMA 9
simple query no complications in understanding.
TVSELECT Technical Digest
Price vs SMA 21 (Short)Close > SMA 21
Price vs SMA 44 (Baseline)Close > SMA 44
Price vs SMA 200 (Anchor)Close > SMA 200
SMA 44 Slope Direction RISING
RSI Strength 60.9Strong
MACD Histogram Velocity BULLISH
Relative Volume (RVOL) 7.13xSurge
Comments ?
Consensus suggests a STRONG BUY (HIGH) exposure profile for HUDCO. The core moving averages are aligned in perfect bullish sequence (s9 > s21 > s44 > s200) with a rising baseline SMA 44. Concurrently, momentum is robust but not yet exhausted according to the RSI.
Stock Scanner for Traders Who ValueEdge Over Hype.
SMA44 delivers institutional-grade market intelligence to every retail trader. From AI-driven Nexus Analysis to custom proprietary queries, find the setups that others miss.