I backtested every Sunday pump above 2% on Bitcoin since 2021 and 90% of the time, it is a trap.
Yesterday Bitcoin pumped 2.6% on a ceasefire headline but if you look at the last 6 years of data then there is a 90% chance of this move getting erased with a red weekly close.
Here is what actually happens after Sunday pumps above 2%.
If Monday closes red after the pump, the week closes red 85% of the time and if Monday drops more than 2%, it gets worse with 90% chances that the weekly candle will be red. In the last 6 months specifically, Sunday pumps above 2% have led to red weekly closes more than 80% of the time regardless of what Monday does.
$67,300 to $69,034, that was Sunday's move. Now here is what Monday needs to do to confirm or kill it:
Monday closes below $69,034 (the open): Base pattern triggers with 85% chance the week closes red.
Monday closes below $67,653 (2% below the open): Strongest version triggers with 90% chance of a red week. This is the level where you know we are breaking below $65K.
Monday closes more than 2.5% above Sunday's high ($71,870): The pump is real and the week closes green 80% of the time. This is the only bullish scenario and anything less than this should not be trusted.
One of these three levels will hit by midnight UTC tonight.
Bookmark this and check it every Monday morning. If Sunday was green by more than 2%, Monday's close will tell you whether the week closes red or green.
Every time Bitcoin has had 6 consecutive red days in a row, Sunday closed green, a pattern with 100% winrate since 2017.
You could have gone long on Sunday every single time and never had a losing trade.
And it does not stop there.
After 5 consecutive red days, Sunday closes green 92% of the time. After 4 consecutive red days, 86%. The longer the market bleeds, the more reliable Sunday becomes as the reversal day.
But here is the part that actually makes you money. The Sunday candle itself is just the beginning. Within 3 days of that Sunday open, the average maximum upside is 5.4%. Within 7 days, it is 7.5%. Within 14 days, it stretches to 10%.
That means if you buy the Sunday open after 4 or more red days in a row, history says you are sitting on a 7.5% move within a week on average. During a bear market. While everyone around you is calling for lower.
And no other day does this. After those same 4 consecutive red days, Monday only bounces 56% of the time. That is a coin flip. Tuesday, Wednesday, Thursday, all coin flips.
Every pattern I have posted in this series tells you when to sell or when to stay out. This is the first one that tells you when to buy. And it works at the exact moment when buying feels the most uncomfortable.
Next time you are watching Bitcoin bleed for 4, 5, 6 days straight and your gut is telling you to sell everything, check the calendar. If tomorrow is Sunday, you are probably looking at the bottom.
Bookmark this.
I found a pattern on Bitcoin that has a 100% win rate across 8.5 years of data. 18 out of 18 with zero exceptions.
Every week, Bitcoin opens at a price on Monday and if by Thursday the lowest price of the entire week has not dipped more than 0.25% below that Monday opening price, the week closes green. Every single time. 18 for 18 since 2017.
The probability of this happening by random chance is 1 in 131,072.
The average return when this pattern triggers is +10.98%. Not 2% or 3% but almost 11% in a single week.
The smallest green was +1.9%. The largest was +28.8%. Even the worst outcome was solidly profitable.
It works in every market condition:
2018 bear market: +28.8%
2022 bear market: +8.6%
2023 recovery: +21.9%
2024 bull market: +11.8%
March 2026, three weeks ago: +10.4%
Bull market, bear market or sideways, it does not matter. If sellers cannot push price even a quarter of a percent below the weekly open in 4 full days, buyers are in complete control. The rest of the week is just momentum playing out.
Every Thursday, check one thing. What was the lowest price of the week so far? If it never dropped more than 0.25% below Monday's open, the week closes green and there will be no further dump, you can stay comfortable in your longs.
Bookmark this and check this by Thursday close (today). If price has not dipped 0.25% below 66,000 (Monday open), there will be no further dump.
Monday decides everything.
I went through 451 weeks of Monday candles on Bitcoin and what I found makes every other day of the week irrelevant.
When Monday is the highest price of the entire week, the week closes red 93% of the time, 120 out of 129 weeks. That means if Bitcoin peaks on Monday and starts dropping, the rest of the week almost never recovers.
When Monday is the lowest price of the entire week, the week closes green 90% of the time, 142 out of 158 weeks. That means if Bitcoin dips on Monday and starts bouncing, the rest of the week almost never gives it back.
When Monday pumps more than 5%, the week closes green 89.6% of the time, 43 out of 48 weeks. If you see a 5% Monday candle, do not sell it. The week follows through almost always.
When both Monday and Tuesday close more than 1% green each, the week closes green 85.7% of the time, 48 out of 56 weeks. Two green days and the week is basically decided.
The probability of all these patterns being random is less than 1 in 100,000,000.
Bookmark the series and use it every week.
What if I told you that Bitcoin's weekly close is already decided by Wednesday night and you can predict it with 85% accuracy?
I tested 451 weeks of data since 2017 and found that if Bitcoin has not pushed more than 1% above Monday's opening price by Wednesday night, the weekly candle closes red with 85% accuracy. The chance of this being a random event is only 1 in 100,000.
The accuracy increases with every day that passes:
Monday close: 61% red
Tuesday close: 72% red
Wednesday close: 85% red
Thursday close: 90% red
Each day that passes without bulls breaking above the open, the probability stacks higher against them.
The reverse also works. If Bitcoin has not dropped more than 0.5% below Monday's open by Wednesday, there is an 86.5% chance the week closes green.
The week is not decided on Friday, it is actually decided on Wednesday and everything after that is just price catching up to what was already determined 3 days earlier.
Bookmark this. Use it every week.
Someone is selling Bitcoin at exactly 5:00 AM UTC every Tuesday for 11 weeks now.
Every Tuesday at exactly 5:00 AM UTC, the 1 hour candle closes red. The probability of this happening by a random chance is 0.049%. That is 1 in 2,048.
I ranked all 168 hourly slots in the entire week. Every single hour on every single day. Tuesday 5AM UTC is the most bearish hour out of all 168. It is the only hour+day combination with a red rate above 80%.
Over the last 6 months, 23 out of 27 Tuesdays were red at this hour and over the last 3 months, 13 out of 14 Tuesdays were red at the same exact hour.
The pattern did not exist before October 2025 and over the full 8 year dataset, this hour is a coin flip. 50/50. It switched on the exact week BTC topped at $126K and has not missed since.
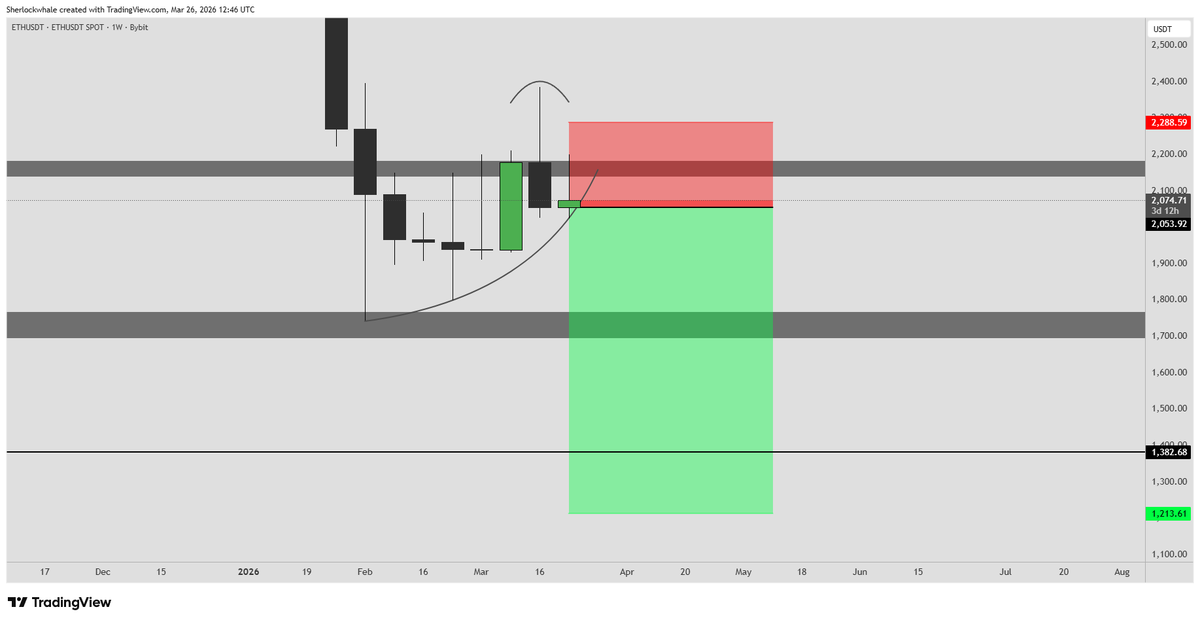
Why would you buy Ethereum at $2,000 when you can buy it at $1,200 in a few months?
The last time ETH had a structure this broken was the drop from $2,000 to $880 in 2022. Same equal highs. Same failed deviation. Same "it cannot go lower" crowd.
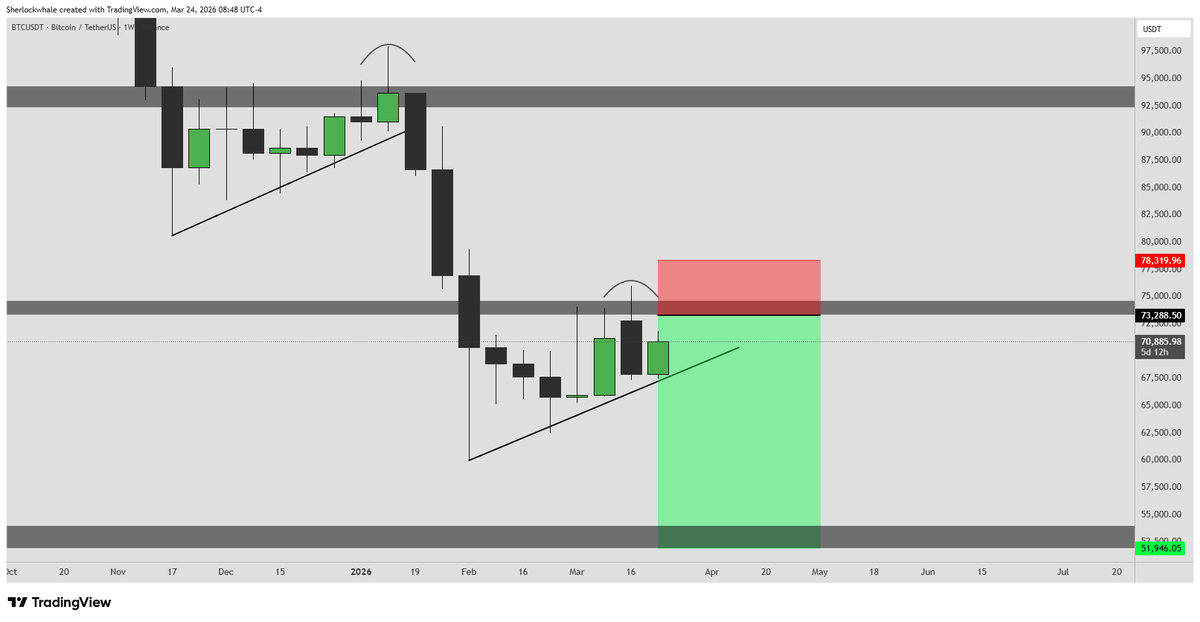
Where there is a trendline, there is always a breakout.
Bitcoin is sitting on the edge of an ascending channel that has held since February. The last three bounces have been weaker each time, been warning about this.
The shit is about to get ugly.
I backtested a simple strategy on Bitcoin since the October 2025 top and found a shocking statistical anomaly.
$10,000 invested. Buy and hold every day and you would have $5,324 right now, down 47% on your investment.
Same $10,000 invested but you skip Thursdays and you would have $8,256, down only 17% on your portfolio.
So, one day of the week accounts for a 29% difference on your portfolio. Thursday has been red 72% of the time since the ATH. I calculated the probability of this happening by a random chance and it is only 2.16%.
Thursdays alone have a cumulative return of -35.51% since the top and the entire bear market so far is -47%. So, just one day is doing 75% of the damage.
If you had done absolutely nothing except close your position every Wednesday night and reopen it every Friday morning, you would have saved 29% on your portfolio.
So, the interesting fact is that this bear market is not happening equally across all 7 days. It is happening only on Thursdays.
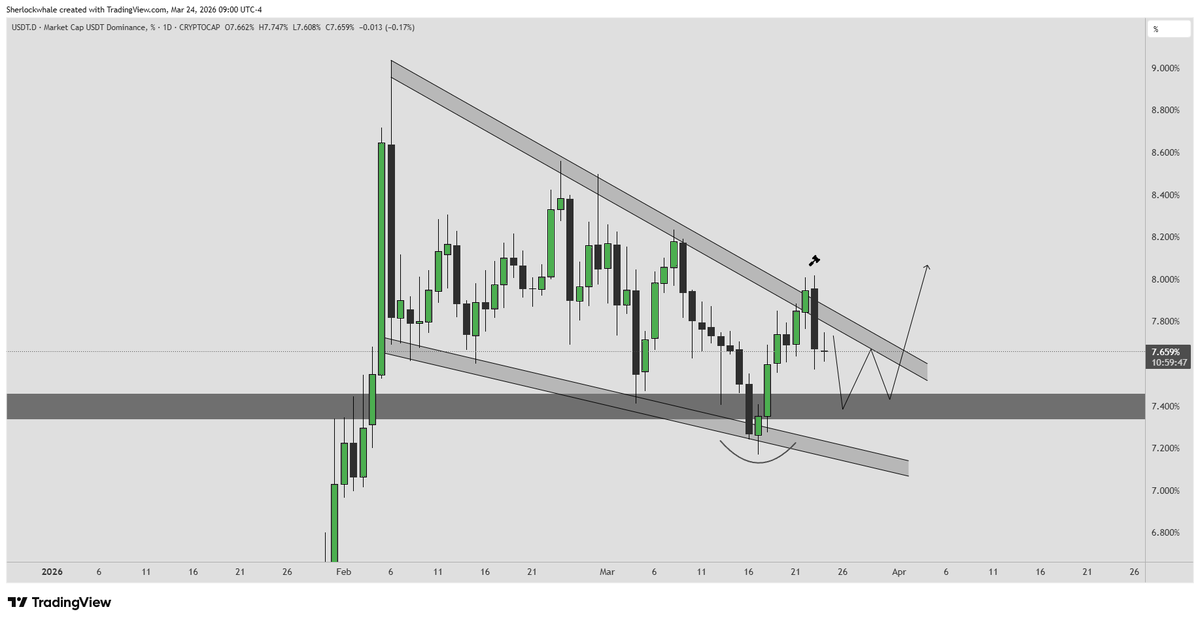
USDT dominance confirms the same setup.
Two things happening on this chart right now.
First, USDT.D gave a failed breakout above the falling wedge trendline and got rejected back inside the pattern. A failed breakout to the upside on USDT.D means stablecoin dominance drops short term which means BTC pushes up. This is the move that takes BTC into the 73.5K short entry zone.
Second, USDT.D printed a massive daily deviation below the 7.35% support level. Wicked below and closed back above. This deviation will get retested. When 7.35% gets retested from above, USDT.D bounces which means BTC drops.
Both charts are saying the same thing. Short term push up into resistance, then down.
Placing my short limit order at 73.5K. Target 53K.
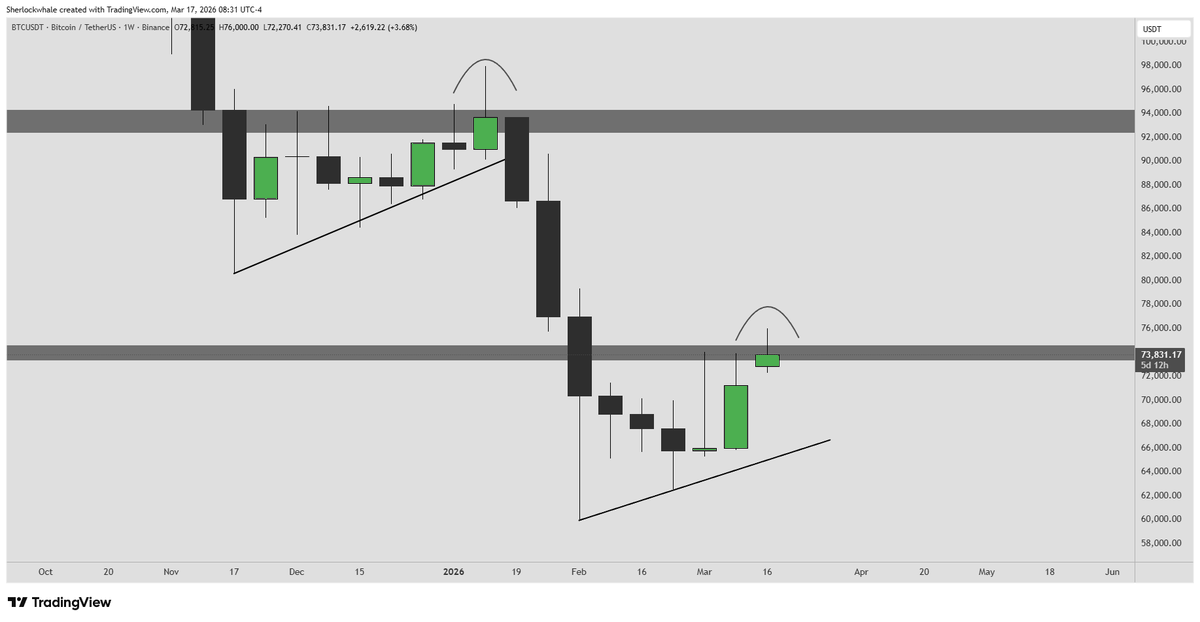
The weekly deviation above 74.5K confirmed last week when price closed at 68K. The first retest of this deviation is the highest probability short entry in the current structure.
Every time BTC has deviated above a major weekly level in this bear market and failed to close above it, price has dropped 25-38% within weeks.
94.5K deviation in January - price dropped to 60K, 36% in 3 weeks.
FOMC held rates. GDP at 0.7%. Core PCE at 3.1%. Oil above $100.
One Truth Social post about a 5 day pause on Iran strikes does not change any of this. Iran has already denied the talks are happening. Trump said "I do not want a ceasefire" 72 hours before posting it.
Short at 73.5K. Stop above 78K. Target 53K.
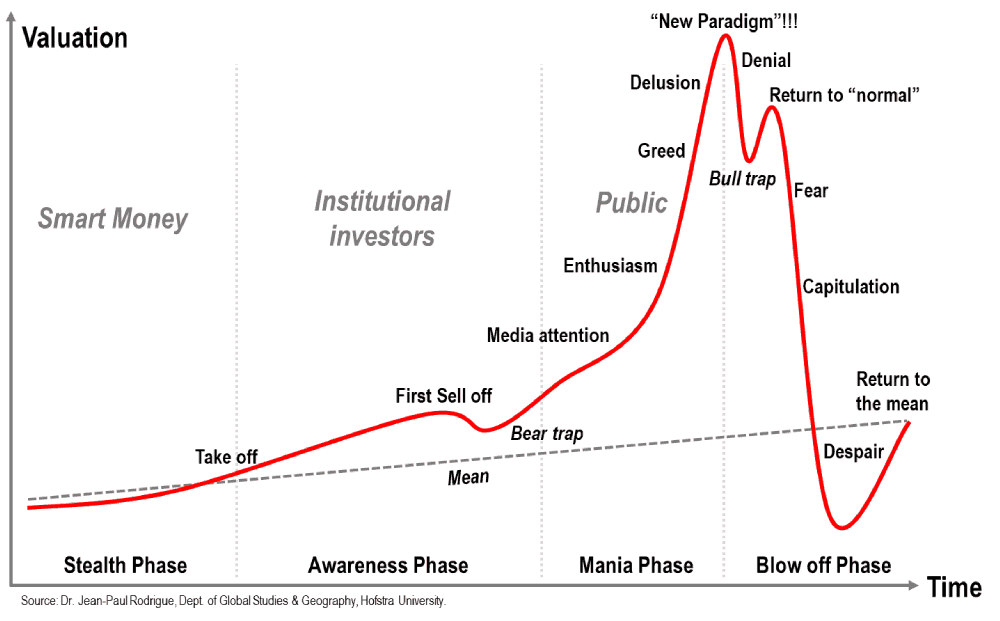
Every bear market has 4 phases.
Phase 1: Denial. "It is just a correction." Oct-Nov 2025. BTC drops from $126K to $95K with everyone buying the dip and nobody panics.
Phase 2: Fear. "This is worse than I thought." Dec 2025-Jan 2026. BTC drops to $68K, ETFs start bleeding. Leverage gets wiped and everyone is nervous now.
Phase 3: Capitulation. "Get me out at any price." This has not happened yet. This is when long term holders break, when the last buyers from $90K-$100K finally sell at $50K-$55K. When MSTR's $76K cost basis suddenly becomes the headline.
Phase 4: Depression. "Crypto is dead." Volume dries up. Nobody talks about Bitcoin for months. CT goes quiet but that is when bottom starts forming.
We are at the end of Phase 2. The worst phase has not even started yet.
Bitcoin is at $70,000 and the timeline says we are 5 months into a 12 month decline at least.
Phase 3 is next.
Do not get baited.
The last time Bitcoin deviated above a major weekly level was 94.5K in January when everyone went long and then price dropped 38% in 5 weeks.
With this wick into 76K, the same structure is forming at the 74.5K resistance.
If the weekly fails to close above 74.5K, this is a deviation, not a breakout.
Also, the January deviation above 94.5K resolved after FOMC held rates and price then dropped to 60K. This week FOMC meets again and the consensus is another pause. A pause is anything but bullish for Bitcoin.
Same setup. Same trap. I am not going long here.
I told you on Feb 17 that $72K-$76K was the kill zone. Not a recovery but a trap. While you are busy buying the bottom, they are selling you the top.
BTC rallied to $76K and you all said institutions were back.
But nobody told you that short term holders sold 243,000 BTC during this exact rally. While ETFs were "buying," the people who bought between $75K-$80K were actually getting out and you were their exit.
Yes, $1.2 billion in ETF inflows over 7 days happened but price couldn't hold $75K for a single day. Think about that. Over a billion dollars of buying pressure and it moved the price nowhere. That money wasn't accumulating, it was simply absorbing the selling pressure from trapped longs cashing out at reduced losses.
Every rally into the kill zone will look like this. Inflows up, headlines bullish, price goes nowhere, then drops.
The kill zone will continue to work exactly as predicted.
You have a choice to wait till October, buy the bottom and get rich or keep acting foolish.