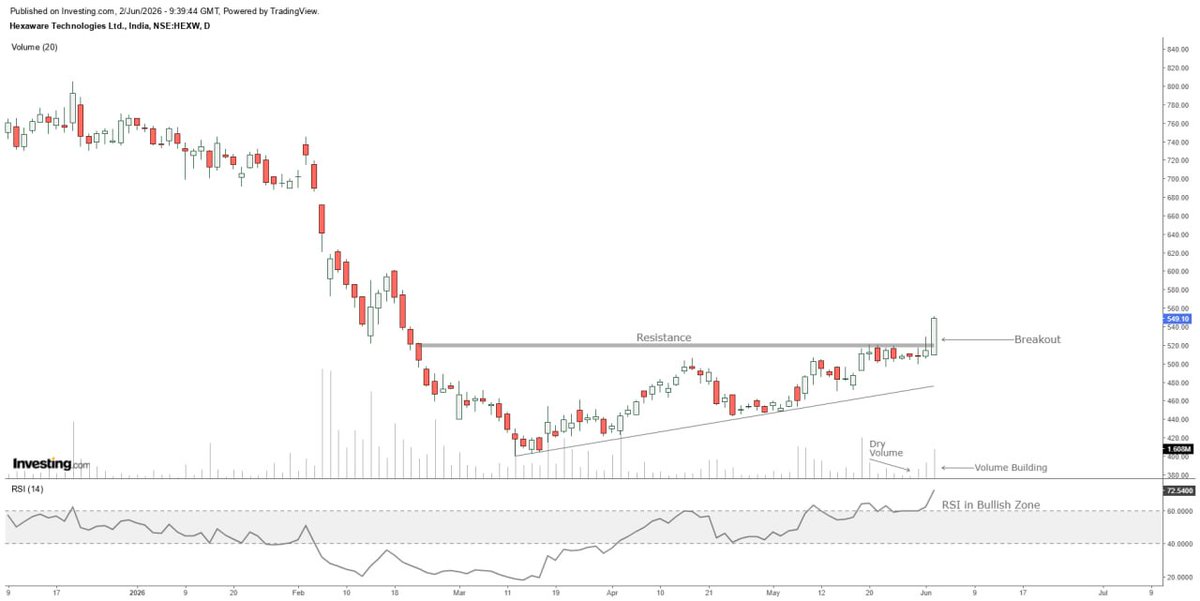
Hexaware Technologies
Breakout above a major resistance zone
Previous resistance now acting as an important support area
Formation of higher lows after the recent recovery phase
RSI trading in bullish territory, showing improving momentum
Volume participation increasing
#hext
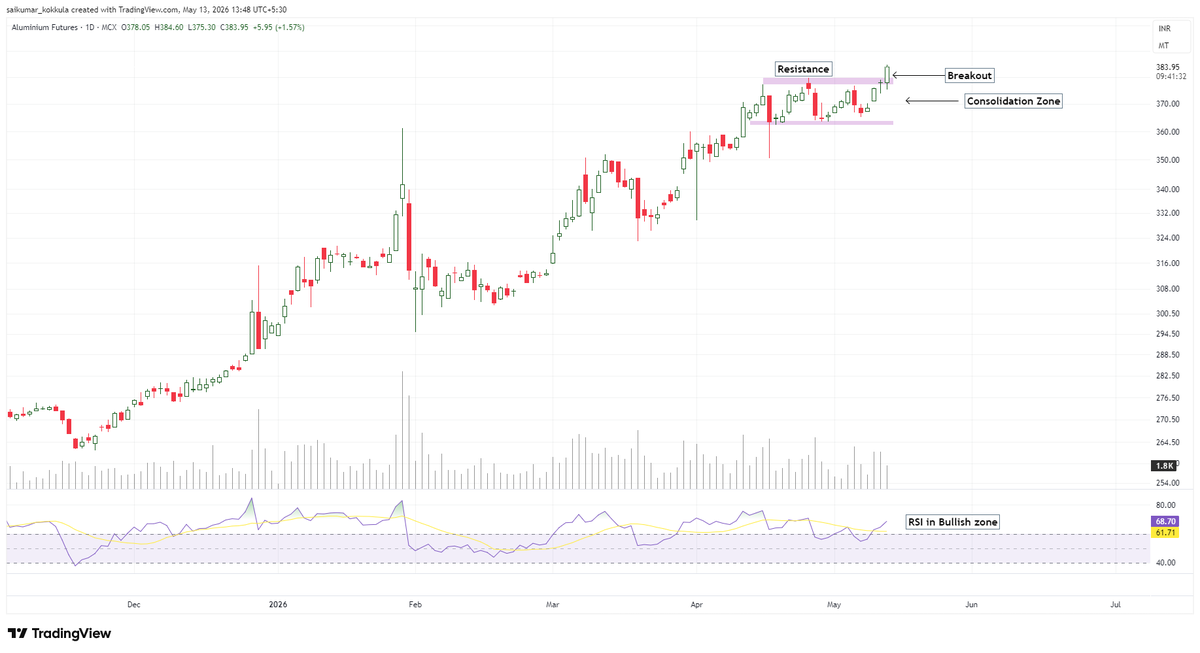
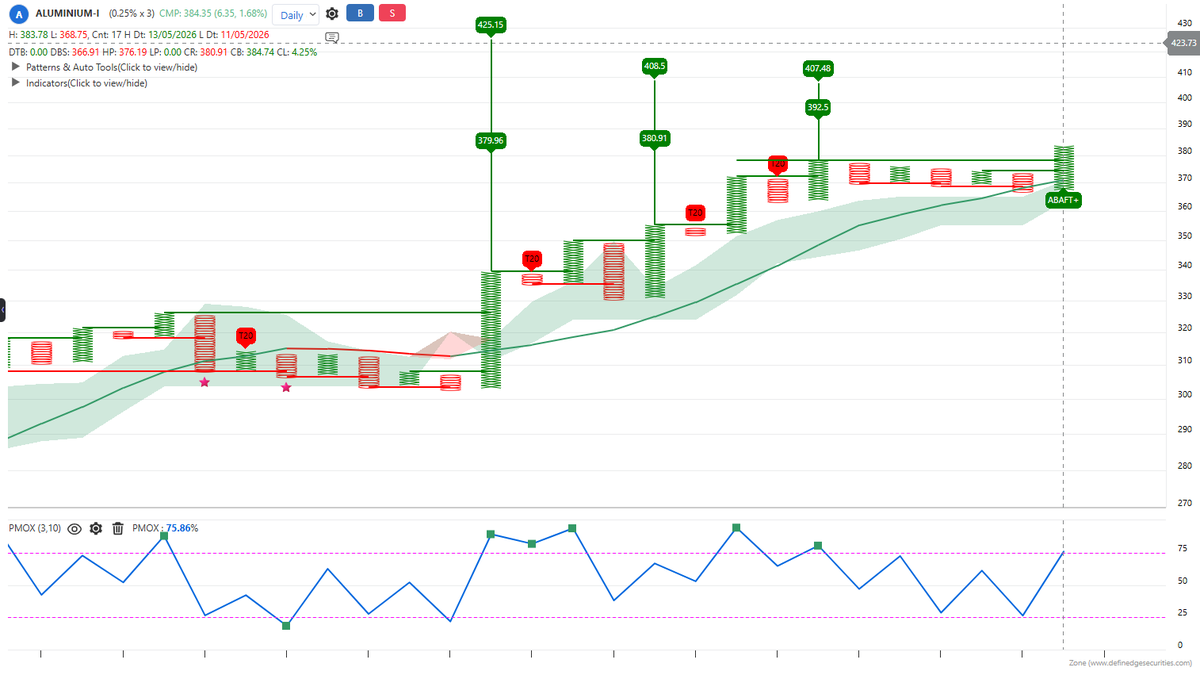
#Aluminium
Consolidation breakout visible on daily chart
Price sustaining above previous resistance zone
RSI holding in bullish zone
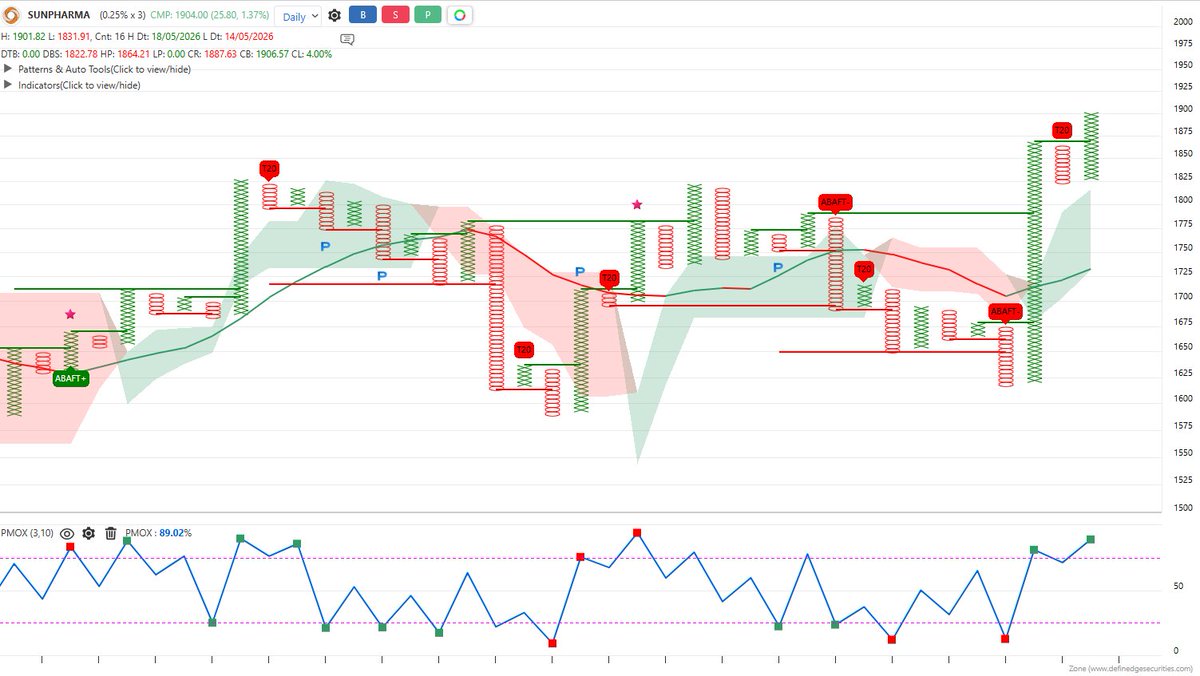
Point & Figure structure showing follow through from the recent consolidation zone
Buying interest visible near breakout area
Thread continued...
At the same time, the Point & Figure chart is also indicating a positive structure with higher columns formation and price made a follow through breakout from the recent consolidation zone.
Aluminium is showing steady strength on the daily chart after moving out of a consolidation range. Price has recently crossed above an important resistance zone and is now holding near the breakout area, which reflects continued buying interest.
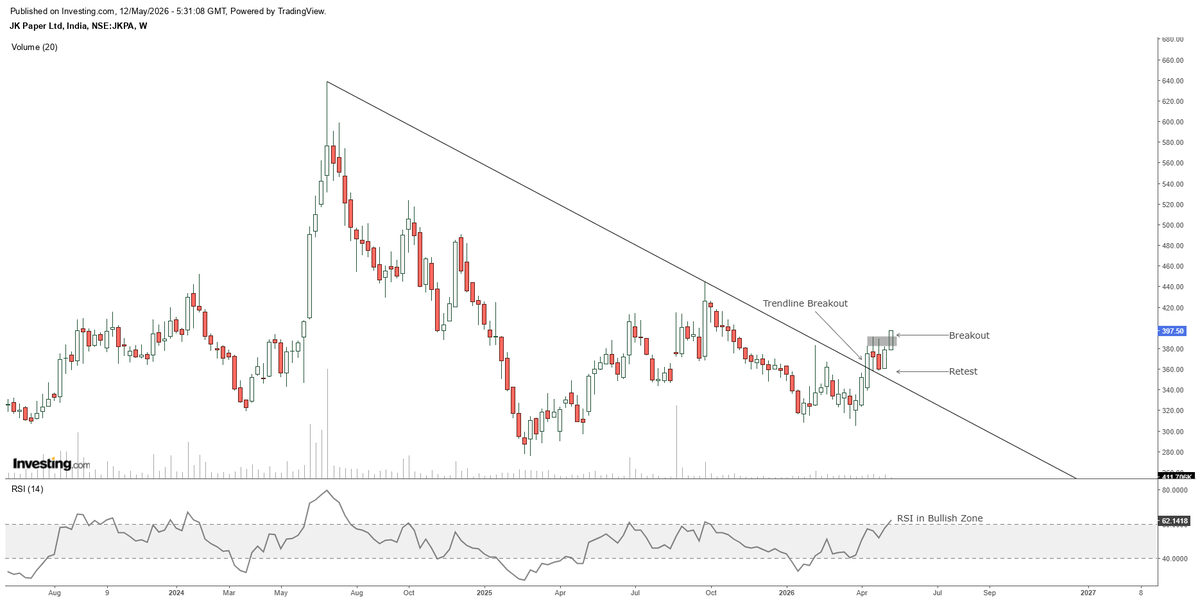
#JKPaper (Weekly Chart)
Long-term trendline breakout visible on weekly chart
Price holding above breakout zone after retest
Strong recovery from lower levels
RSI moving in bullish territory
Gradual strength seen in recent weekly candles
#PaperStocks#StockMarket#SwingTrading
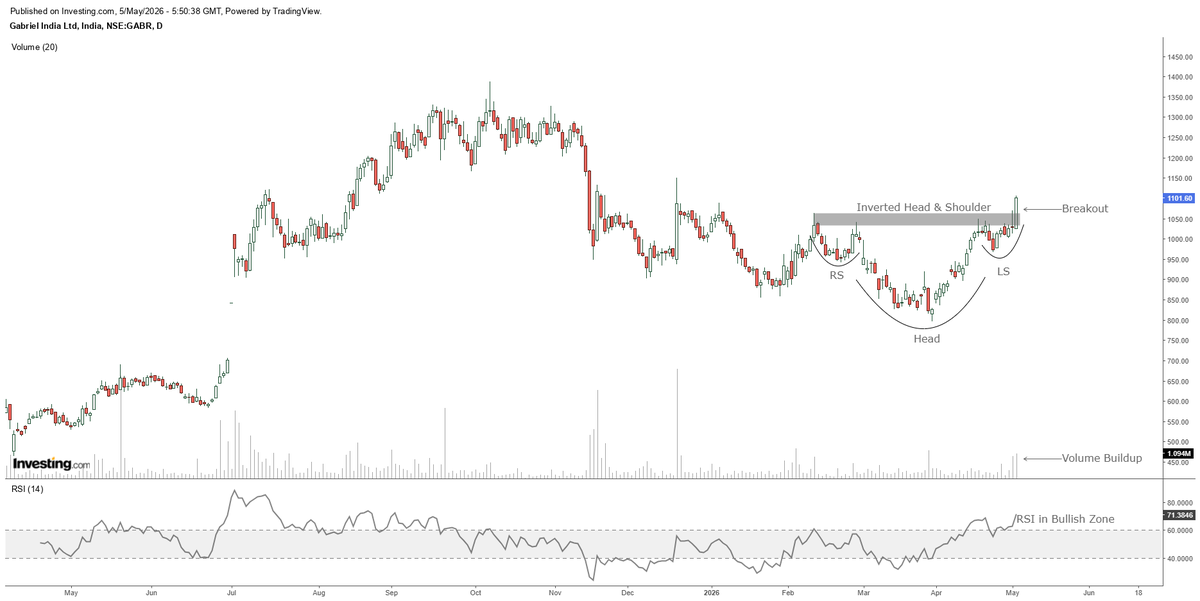
Laxmi Organic Industries (Daily Chart)
Inverted Head & Shoulder breakout visible
Price moved above neckline resistance zone
Strong recovery from recent lows
Volume buildup visible near breakout area
RSI holding in bullish territory
#LXCHEM#StockMarket#TechnicalAnalysis#NSE
#HAL
Symmetrical triangle visible on weekly chart
Price approaching upper trendline resistance
Strong bounce from lower support trendline
Recovery seen after recent correction
RSI improving from lower levels
Will it break out, face rejection, or continue consolidating from here?
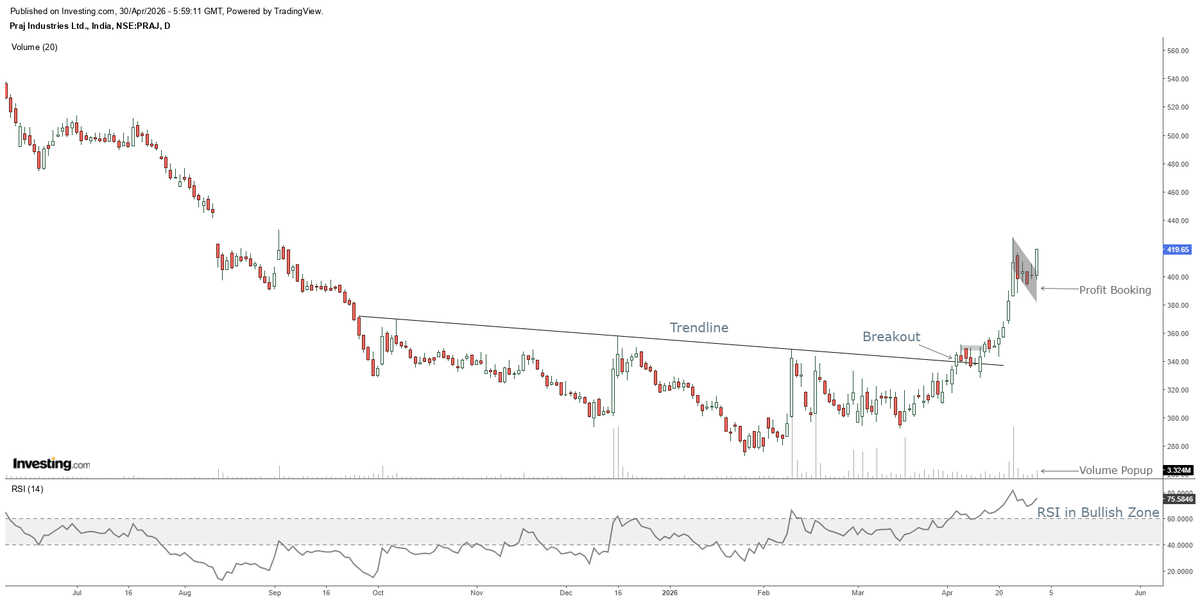
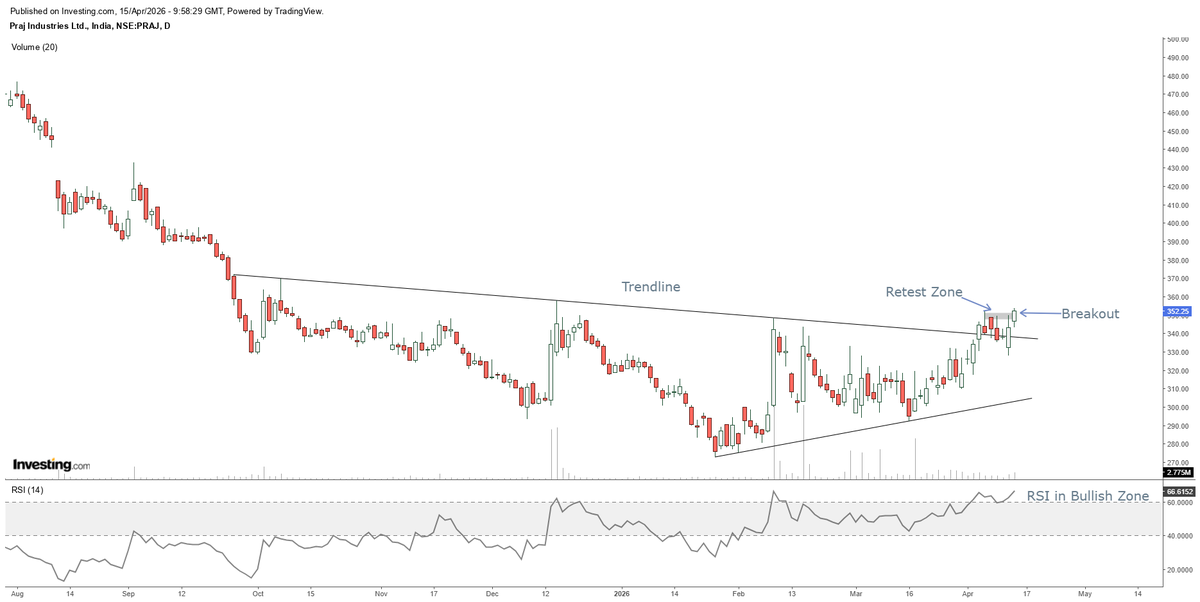
Praj Industries(Daily Chart)
Strong breakout from long-term falling trendline
Sharp rally supported by volume pickup
Minor pullback after recent rise
RSI remains in bullish zone
Overall structure still stronger than earlier phase
Is it getting ready for the next move?
#PRAJIND
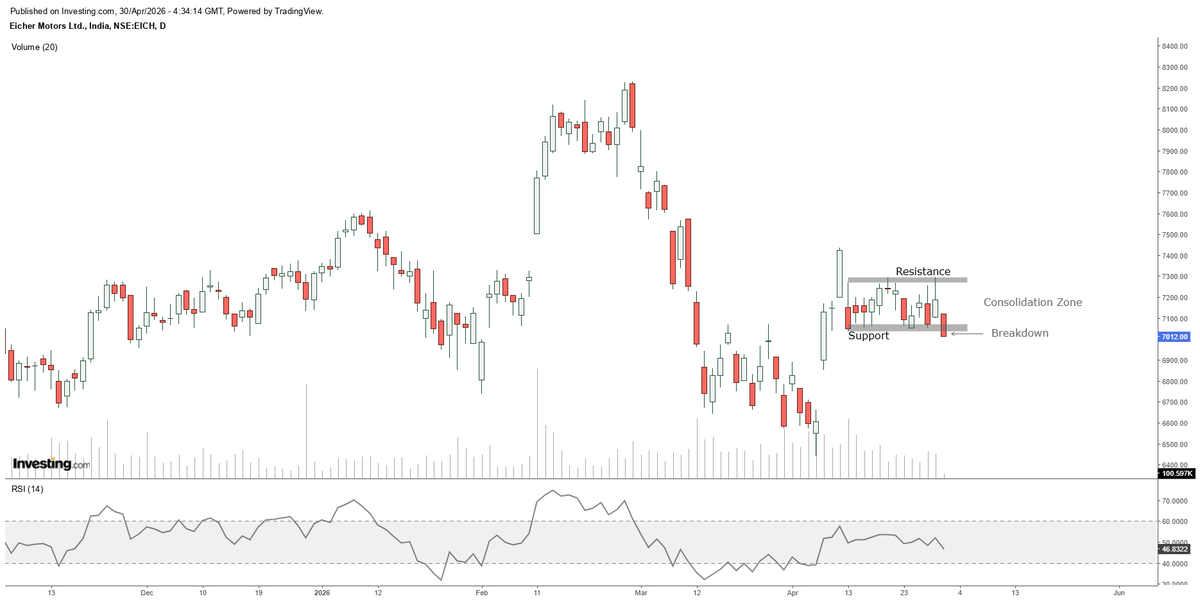
Eicher Motors (Daily Chart)
Sideways consolidation after sharp bounce
Resistance placed near upper range zone
Support zone recently under pressure
Breakdown attempt from lower band visible
RSI near neutral zone, showing mixed momentum
#EICHERMOT#StockMarket#TechnicalAnalysis
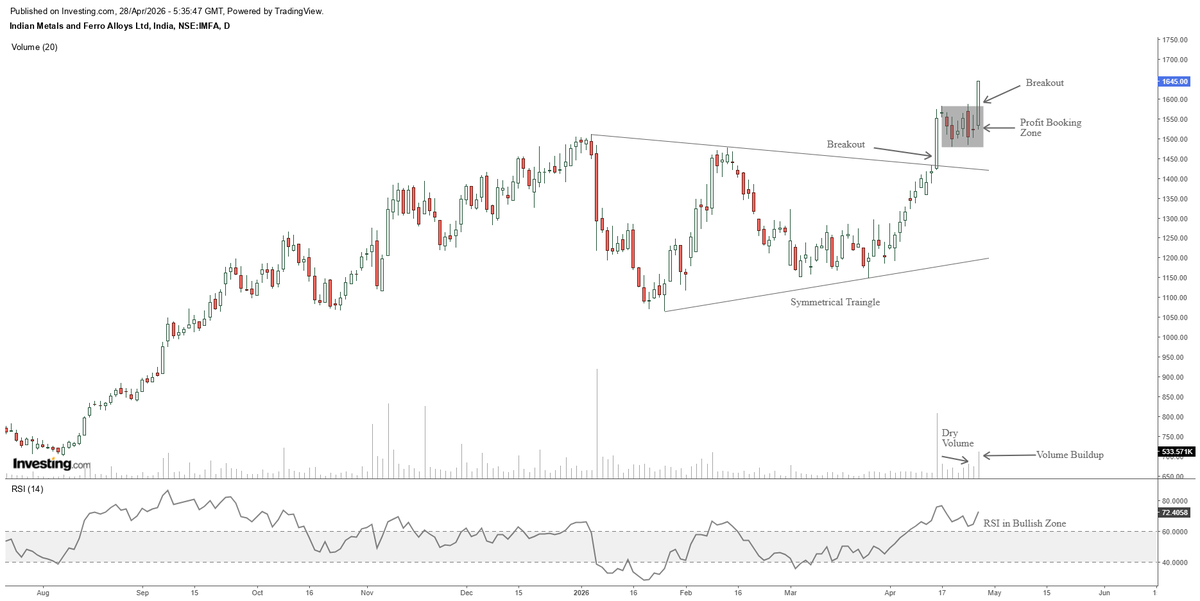
#IMFA (Daily Chart)
#Breakout seen from symmetrical triangle pattern
#Price moved higher after crossing resistance zone
#Small consolidation near recent highs
#Volume activity improving during the breakout phase
#RSI in bullish zone, indicating positive momentum
#IndianMetals
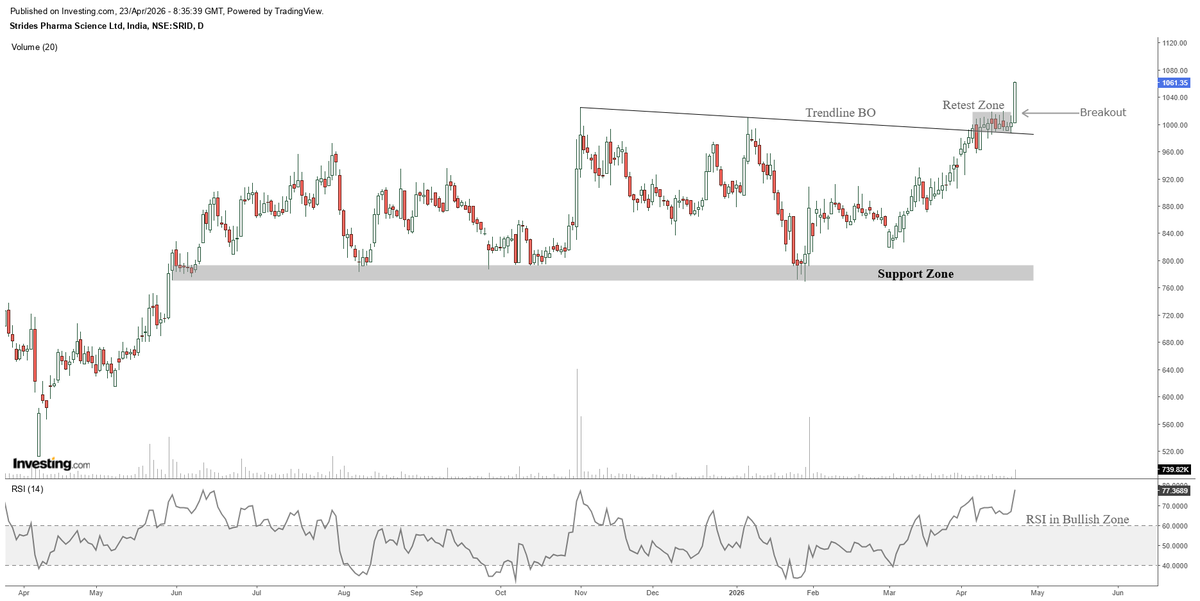
Strides Pharma (Daily Chart) 📊
• Breakout above falling trendline
• Price holding near retest zone
• Strong move after consolidation phase
• RSI in bullish zone
• Price reacting well from earlier support zone
#StridesPharma#StockMarket#TechnicalAnalysis#PriceAction
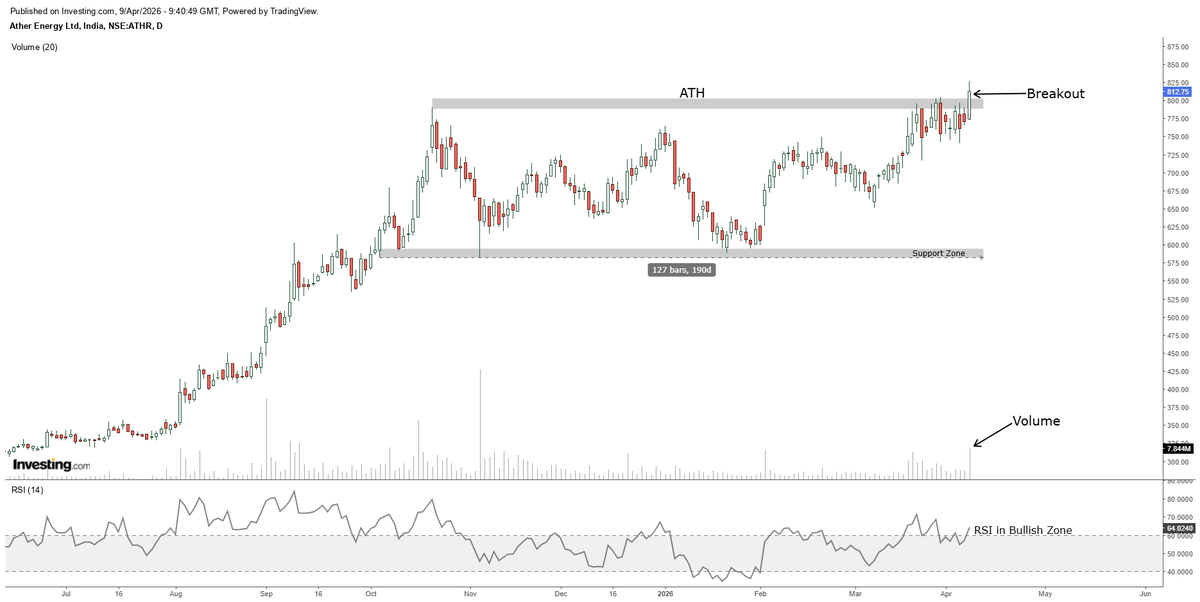
#ATHERENERG (Daily Chart) 📈
• Price near a major resistance / previous high zone
• Fresh breakout attempt visible
• Volume showing improvement near the breakout area
• RSI remains in the bullish zone
• Broad consolidation appears to be turning into a range breakout setup.
When fear is everywhere, data speaks louder.
Charts suggest limited downside, while upside is building…
Time to connect the dots. Let’s connect.
28th March 2026 | 11:00 AM
🔗 Join: https://t.co/9qU4YwusEo
🆔 338 107 2476 | 🔐 123456
#stockmarket#charts#marketoutlook@jainambroking