Extracellular RNA (eRNA) in drinking water systems may be more than cellular debris—it could play important signalling and regulatory roles, while providing new insights into microbial persistence and antibiotic resistance.
https://t.co/WGffComYgu
Reading a scientific paper takes hours. No PI, no student, can keep up. And keyword search finds words, not ideas.
So we built a Research Process Graph: a new way to read the literature.
https://t.co/ndaFZyEQp7 🌱 1/7
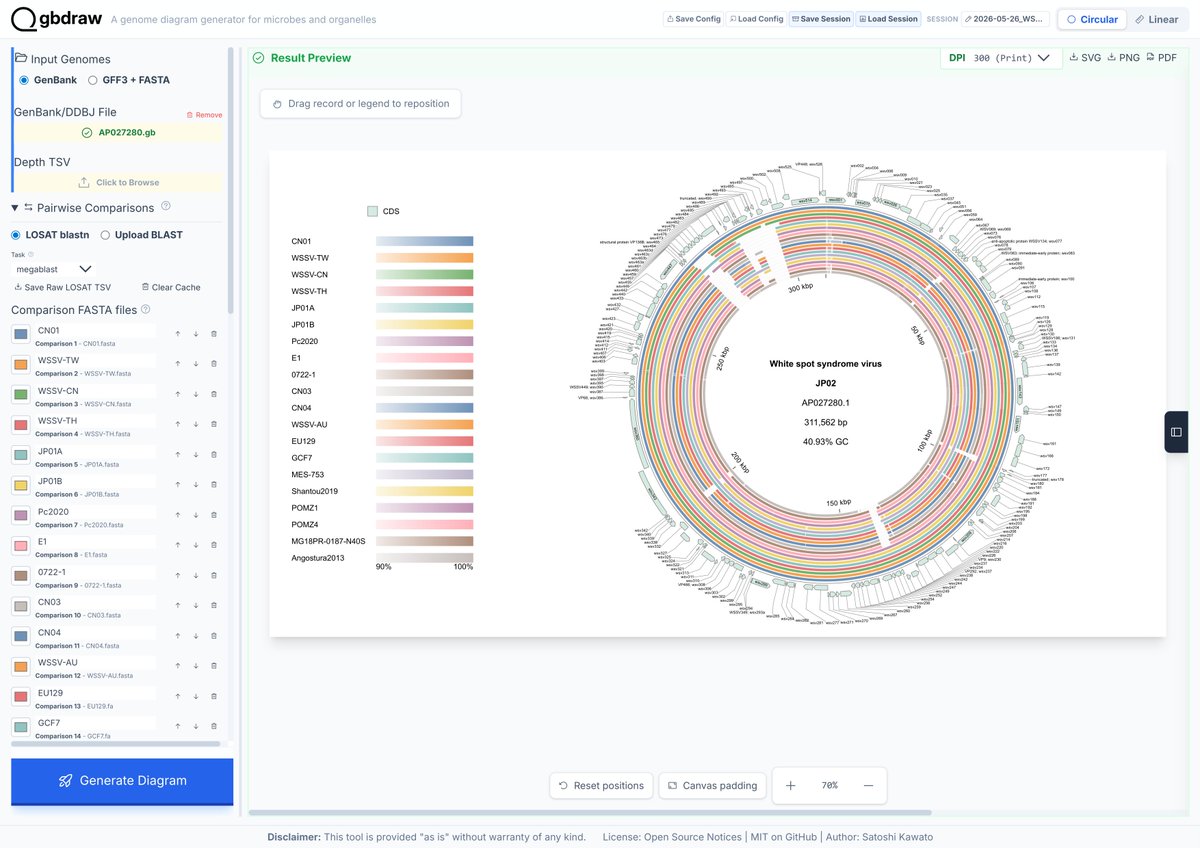
Circular genome comparison is now live in #gbdraw! 🚀 The built-in LOSATN instantly runs pairwise alignments and generates homology rings for your sequences, 100% in your browser! Try it out: https://t.co/ZA4FoGdp7l #bioinformatics#genomics#microbiology
Spatial and genetic constraints govern transcription–translation coupling and mRNA degradation in bacteria | Nature Microbiology https://t.co/gIVCqcSLBa
Revised 16S rRNA V4 hypervariable region targeting primers enhance detection of Patescibacteria and other lineages across diverse environments https://t.co/JrImTBQQ9o
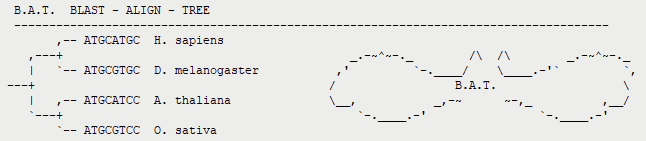
We are excited to release the BAT! 🦇🚨
We've used this phylogenetic analysis pipeline in our lab for years, and grad Ben Sheppard now presents a Github release and preprint.
I run BAT analyses almost daily. It makes exploring gene families routine, customizable, and fun🧵
Easily visualize flows in categorical data with the R package parcats. It lets you build interactive parallel category plots to explore how categories change across stages or time points. Built on plotly, fully interactive, and works well with tidy data.
Ideal for:
✔️ Longitudinal data
✔️ Survey response changes
✔️ Multi-stage classification
✔️ Categorical transitions
The visualization below shows a parcats plot created from an alluvial-style dataset in wide format. It’s taken from the package website: https://t.co/eKdlTVWbFe
Stay updated on R, Python, and data science tools. Join my newsletter today.
For more information, visit this link: https://t.co/ktUcWo9XpO
#datasciencetraining #DataViz #Rpackage #DataVisualization #RStats #Data #coding
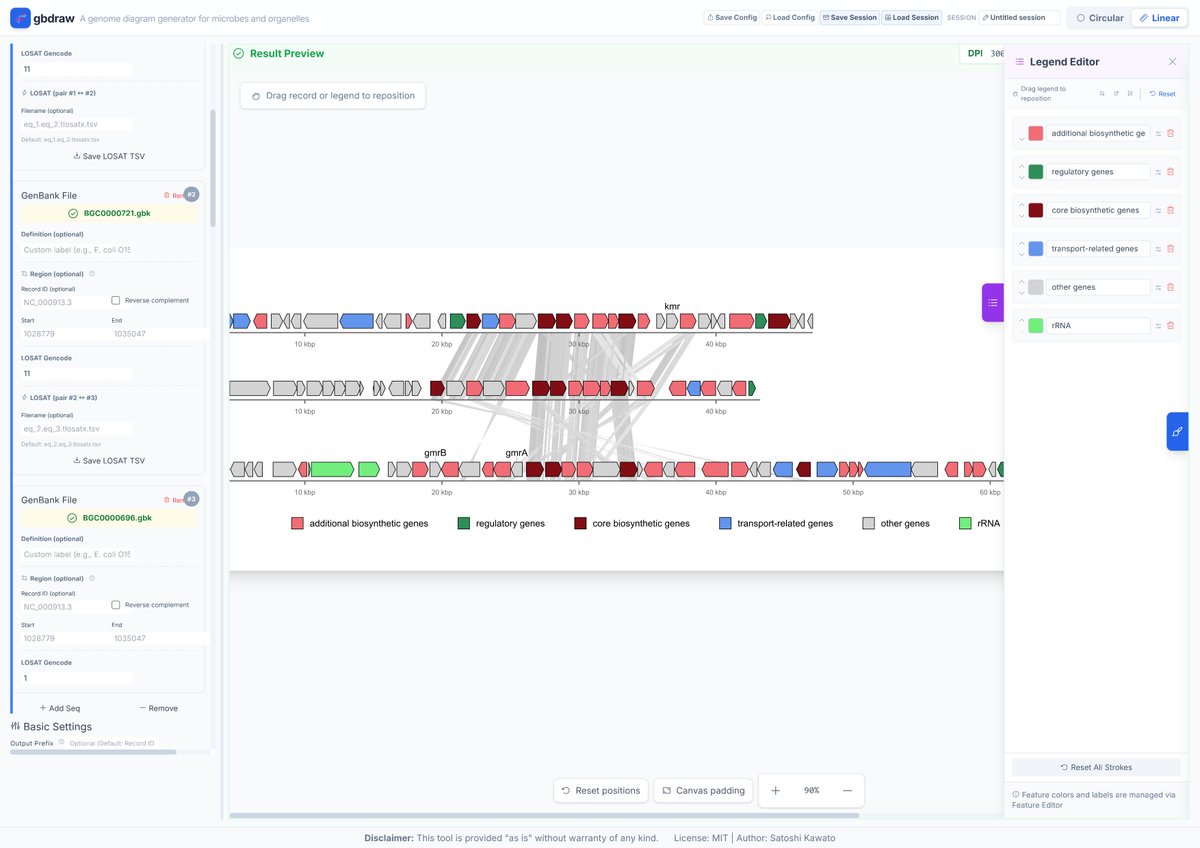
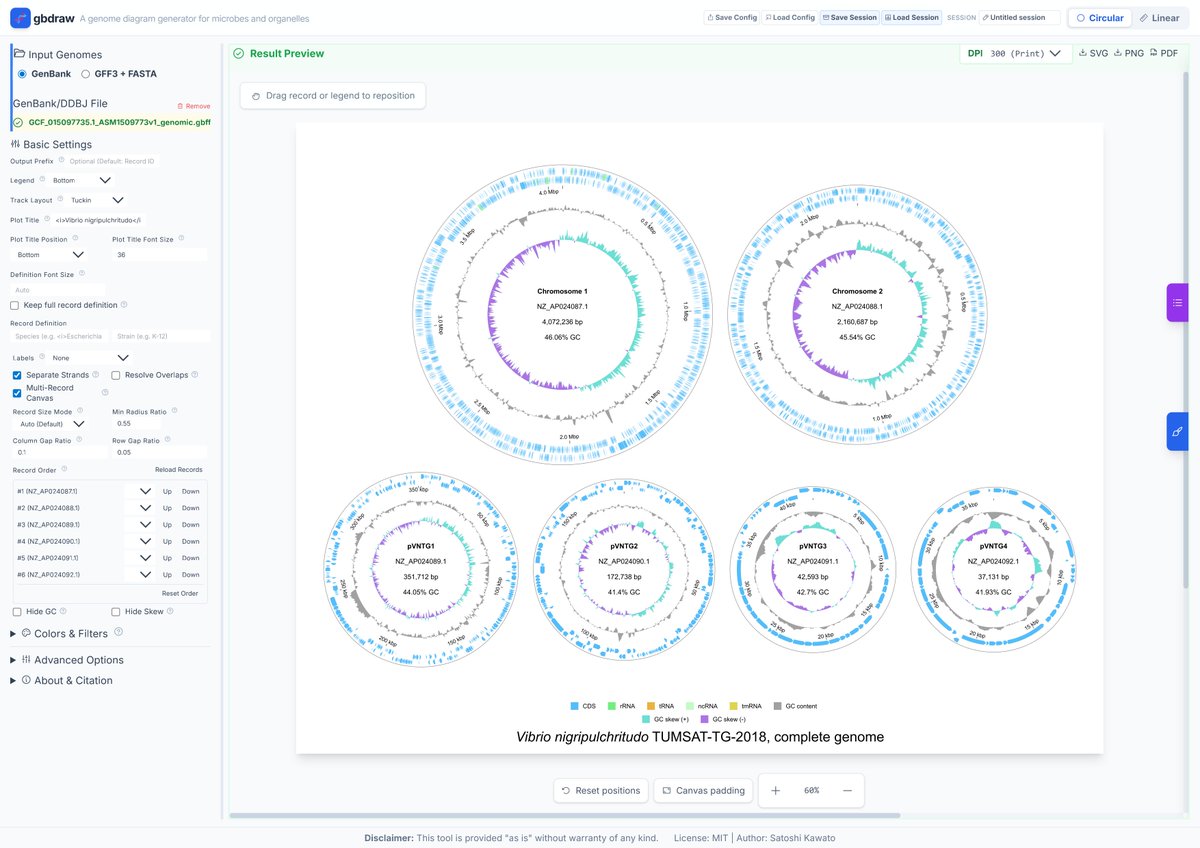
Big update for #gbdraw!
- Multi-record circular plots: Genomes with multiple replicons can now be displayed in a single view!
- Advanced linear plots: Focus on regions of interest with granular control over feature selection and color-coding!
Try now: https://t.co/ahqoRxbDHT
Protein–protein interactions (PPIs) are key to discovering and interpreting new biological functions.
We’re excited to introduce 𝑭𝒍𝒂𝒔𝒉𝑷𝑷𝑰: a new application of gLM2 that uses genomic language modeling to predict proteome-wide PPIs in microbial genomes in minutes.
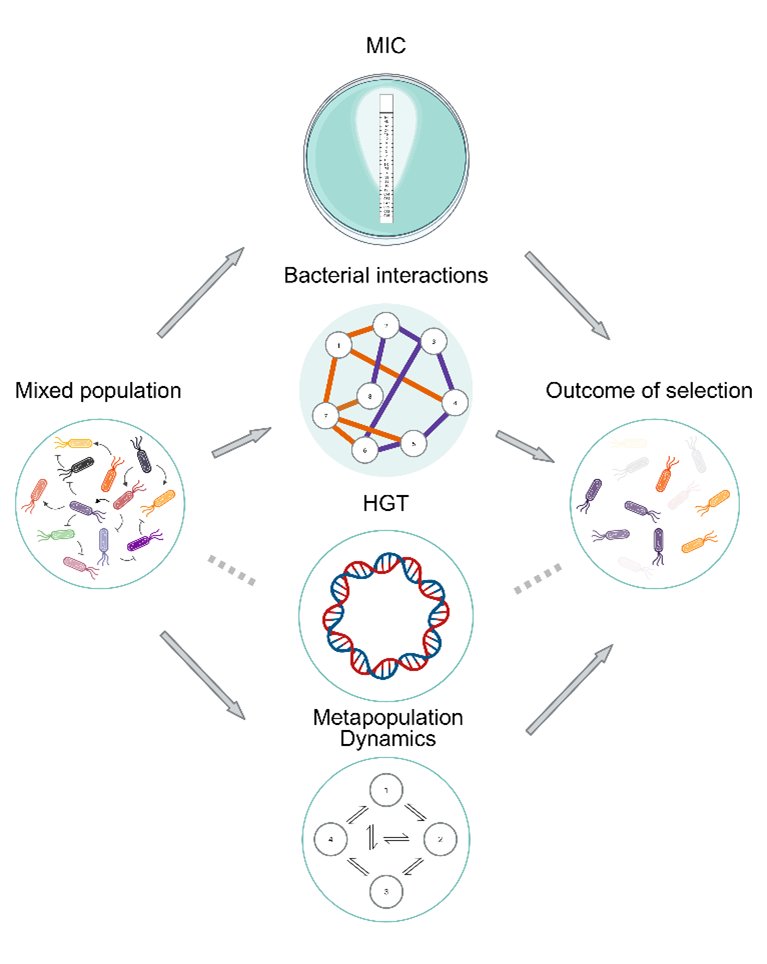
📢 Our paper is now out in @ISMEJournal! 🦠
What happens when a pathogen population is genetically diverse AND under antibiotic pressure? TL;DR #AMR is a community effort!
#Pseudomonas aeruginosa
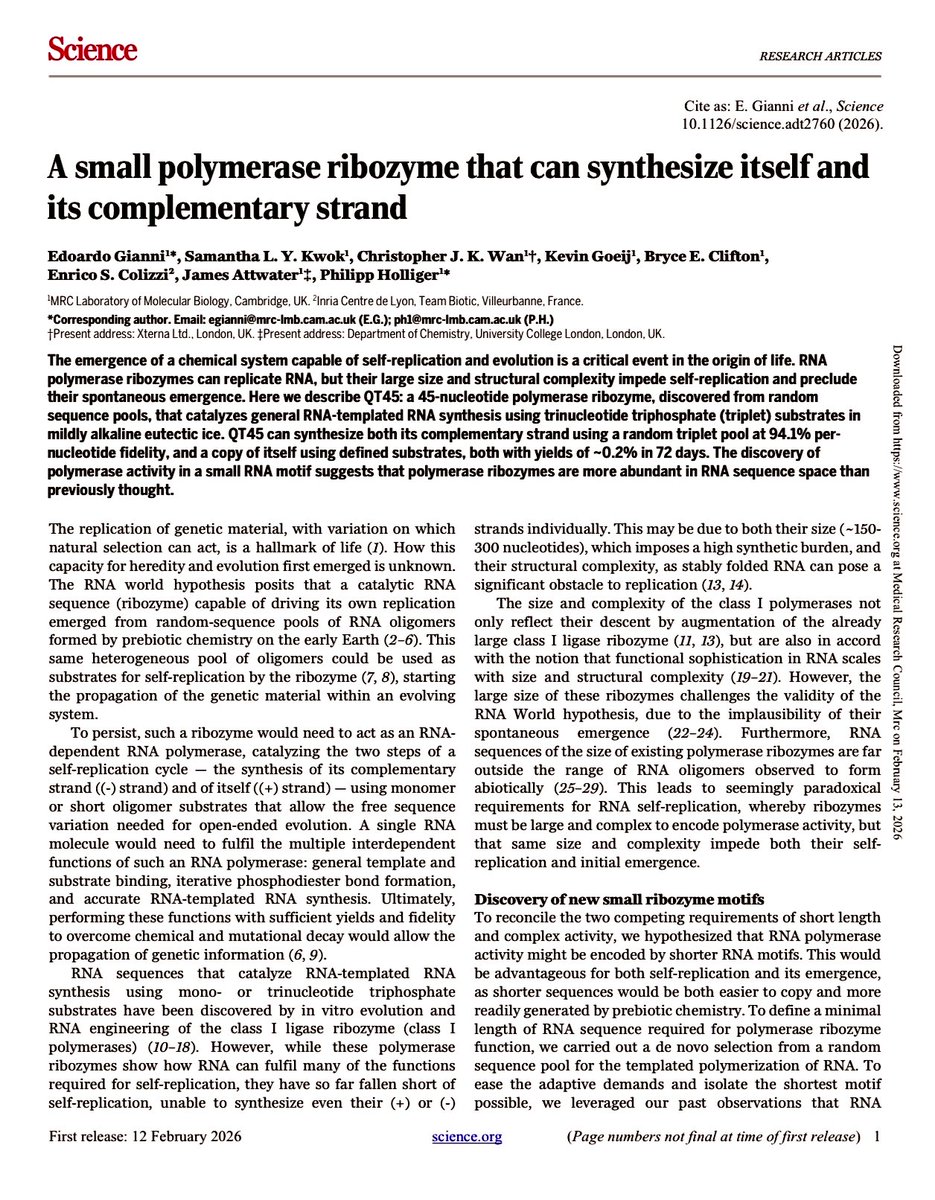
A major work from our lab is out in Science! @ScienceMag, another key step towards a true demonstration of RNA self-replication. https://t.co/2Fe8XonYst (1/6)
MicrobTiSDA: A flexible R package for inferring interspecies interactions and abundance dynamics in microbiome time-series data
https://t.co/P6Q4xouIlD
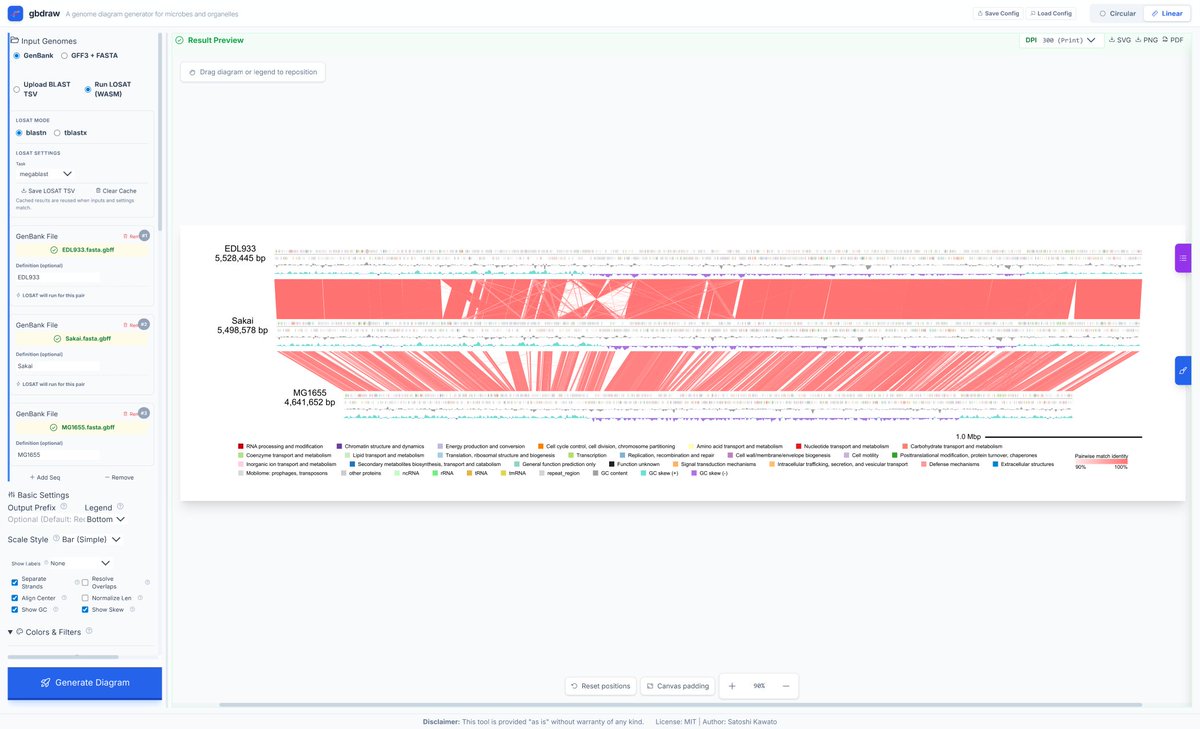
Visualizing pairwise genome comparisons? No need to run BLAST separately anymore! 🧬
#gbdraw has implemented #LOSAT, a WASM-powered Rust reimplementation of BLASTN/TBLASTX.
✅ No local installation
✅ No data transfer (Serverless)
Try it here: https://t.co/ahqoRxbDHT