#Bitcoin – What’s Next?
The Big Sunday Report: All We Need to Know
TA / LCA / Psychological Breakdown:
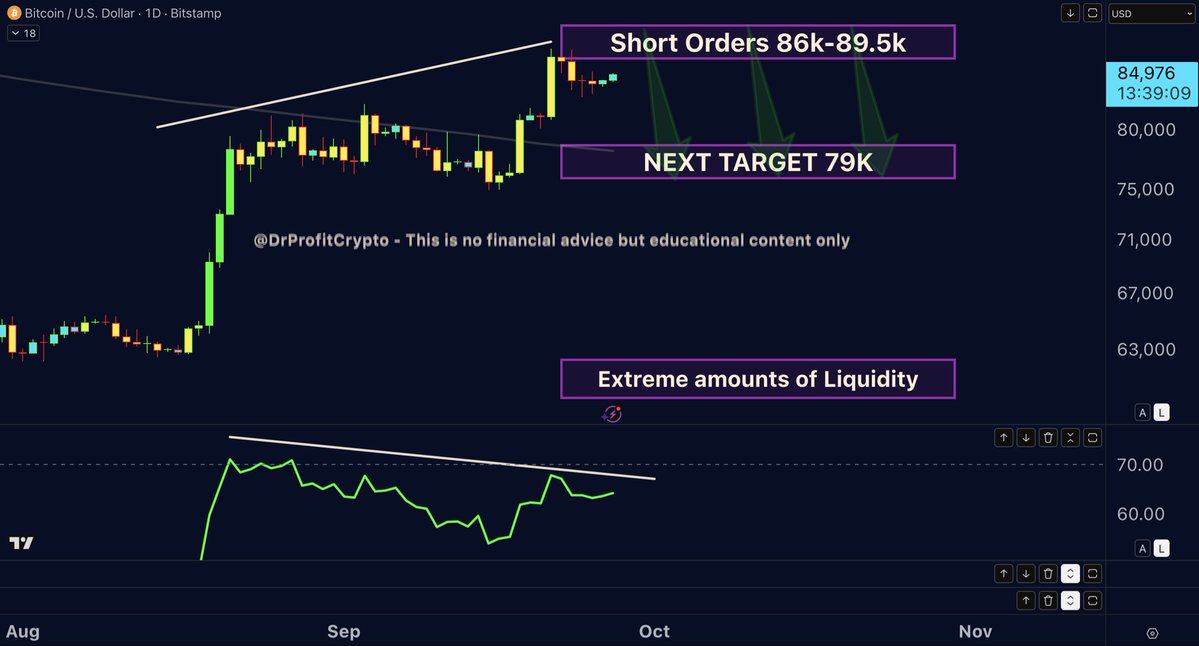
Several weeks ago, when Bitcoin was trading around $60,000, I called for $88,000. Last Sunday, I repeated that target and explained why the rejections at the MA50 Weekly did not change my bullish outlook, and to make it very clear: Last week the sentiment was completley different than today, last week almost everyone was bearish and was calling for a rejection at the MA50 weekly, in fact i called for a breakout and justified it We had seen a similar pattern in early 2023, when several failed attempts were followed by a breakout. A few days after my report, Bitcoin reached $87,300, less than 1% below my target. After anticipating this move from $60K, I consider the $88K target area effectively reached. The move I expected has played out, and while a target has fully achieved for me, i saw plenty of bears capitulating and turning bullish, at the exact region where my plans shifted towards a short accumulation.
Now my focus is on the next move. I entered a short around $86,200, and placing within the $86K–$89.5K area several short orders, and my first downside target is $79,000, around the MA50 Weekly. Important i mention first, this does not mean that there is a second target lower, but 79k and then i can tell based on BTC reaction, but for now its 79k and continue to a new high and continuing the bull. Let me make this extremely clear: I consider Bitcoin to be in a BULL MARKET, but I expect a correction WITHIN that bull market. My spot positions accumulated around $60K remain open. The short allows me to position for a pullback while maintaining my longer-term investments. At $79K, I want to see whether the MA50 Weekly holds as support. That reaction will guide whether I take profits on the short or continue holding if support fails.
Also four key indicators are showing bearish divergences, RSI on daily, the most important one for me, alongside ADX, MACD/PPO and MFI. RSI, MACD/PPO and MFI show bearish divergences, while ADX shows weakening trend strength. That is why I’m using the short to reduce my net exposure, aiming to turn any profits into more coins before the next leg up.
Further below, I have marked the substantial liquidity area around $62,000. It remains relevant if the correction develops into a deeper move, but my main target remains $79K , For now, my positioning is clear: spot holdings remain open, the short was entered around $86,200, and additional short orders are placed between 86k - 89,5k and I am targeting a move toward $79,000 before deciding the next step. I remain bullish on the larger trend while preparing for a correction after the move into my target of $88K was hit
THIS IS NOT FINANCIAL ADVICE, BUT EDUCATIONAL CONTENT ONLY.
Join Premium: https://t.co/Qx4dZU40Lk
$BTC: Since two months we move sideway
As I said in June, 57-67k is the range
And the next leg down is programmed
Nothing to worry about, all is programmed
#Bitcoin – What's Next?
The Big Sunday Report: All We Need to Know
🚩 TA / LCA / Psychological Breakdown:
Everyone bullish here is making a big mistake, and don't misunderstand my words. I clearly speak about those who are buying now long term, believing the bottom was in. Everyone who is buying now is just flooding the market with liquidity the market needs, not only STRC, but also miners and other crypto businesses. While most altcoin businesses died on 10th October 2025, some crypto businesses, venture capitalists, hedge funds, custodians, lending platforms and yield protocols are on the verge of collapse, and ahead of them the golden horse and master of the collapse and the person who was the biggest loser of the DOT COM BUBBLE, in terms of BILLIONS of dollars lost, Michael Saylor and his company MicroStrategy. Again: everyone buying now is donating money to a collapsing system, and it's the crypto system that is collapsing NOW. I am not saying it won't recover, but I say it's not worth entering for now. I will enter, as I remain bullish on the long haul, but for now I don't even touch crypto products and am just waiting to buy the next leg down on Bitcoin that should bring us to the range of 50k and wicks below 50k. DrProfitPremium is for free till end of June. You can join now: https://t.co/SBmkqCqyeg
I described where I see the bottom last week, and two weeks ago, and even at 120k I said 60k will be the first bottom, and what follows needs to be the capitulation. I did that by sharing the boxes and stages, and clearly we are at Stage 5, the moment I am awaiting the capitulation to happen. Bitcoin has never bottomed out without a miner capitulation, so I am asking all those, and I wonder what inexperienced people they are, how do you call for a bottom without a clear miner capitulation? The miner capitulation that follows the sell-off is a blow of a large venture capitalist, fund, or even an exchange. Last year it was FTX, but also Three Arrows Capital (3AC), Alameda Research and its connections to FTX, Digital Currency Group / Genesis, BlockFi, Voyager, Celsius and so many other names that have been under extreme pressure, some on the verge of collapse and some that truly collapsed. Yet we haven't seen such an event this cycle, and I would even argue the crypto market is not strong enough to survive such a bear market without one more major casualty.
This aligns perfectly with what a former ETH Foundation staffer warned recently: that Ethereum could face a core developer funding crisis within 3–9 months. He says Ethereum needs roughly $30M per year to fund the ETH Foundation: and we speak about the same foundation that kept selling ETH, financing their own pockets, and now simply says they can no longer finance the project. People don't understand what this means. It tells us that the core developers of ETH won't be able to work on ETH in the future if there is no more funding, and with all the recent years we can clearly tell that ETH became a failure. Either you accept it, or you keep investing in a sinking ship. This is what I warn about: funding issues will hit centralized places, the large capitulation is ahead, and I don't see the bottom here.
The Chart and My Trading Plan
Bitcoin is now forming a massive bearish flag on the daily timeframe. I see a lot of noise regarding the current price and people talking about buying no matter at what price, and everyone seems to ignore the fundamentals, the on-chain data, the macro, and even the simplest chart analysis that shows a clear bearish flag right in front of us. The positivity in the market is back, and liquidity has started to build massively below us in the last 60 days.
So far in this cycle I have shorted at 120k, at 80-82k, and now I am looking to place short orders in the region of 68-69k. Two weeks ago I said I am expecting Bitcoin to pump towards 67-68k, and exactly as expected BTC went to 67k before starting to go down again. What many do not realize in a sideways move is that a price point can be visited several times, and I am now preparing my final short orders at 68-69k in case the market allows us to visit. Again: I am not saying with 100% these targets will be hit, as the momentum remains extremely bearish, but I am saying that if the market allows us to visit this area, I am willing to add to my shorts. My target is a dump to 54-56k region first before we move sideways once again and afterwards another leg down and the bottom is close in the region between 40-50k in my opinion.
The plan worked at 120k. The plan worked at 60k of phase 1. The plan worked at the 71k long. The plan worked at the 80-85k bull trap top. The plan is working now in Stage 5. The capitulation is ahead, and the CBB is the destination.
THIS IS NO FINANCIAL ADVICE BUT EDUCATIONAL CONTENT ONLY.
#Market:
I have never been positioned into more short positions than today, with over 120 active shorts across BTC, stocks, and indices. In other words, I have never been more heavily positioned for downside than I am right now.
Putting every single dollar in this trade!
$BTC: Last week I made it very clear:
Bitcoin was not in a strong reversal but in a 58k–68k sideways range. Bitcoin got rejected at 67.2k, right near my maximum upside target. Everyone who called the bottom was in needs to wake up
$BTC:
1. Shorted the top at 120k called for 60k
2. At 60k I said, bull trap starts, pump to 80k
3. At 80k I said, bull trap is over, dump to 60k
4. Now at 60k, looking forward to Target 3
Congratulations for everyone who listened
My $BTC Short from 120k is printing big
My BTC Short from 80k is printing big
The 100 altcoin short is printing big
Tons of Stocks shorts printing big
Only the SP500 remains to print big ⏳
#Bitcoin: How many times have I said the crash starts from the 80–85k region?
How many times have I called for shorts in this region?
How many Sunday Reports have I published and explained it?
#Bitcoin – What's Next?
The Big Sunday Report: All We Need to Know
🚩TA / LCA / Psychological Breakdown:
Last week in the Sunday report that was shared in Premium only, mentioned that 50% of the short position was filled with an average entry of 80,500 in the 79-82k batch, with the remaining 50% sitting in orders between 83-85k. Nothing has changed in the plan, and the market continues to deliver exactly what we have been waiting for since the call at 120k. The 120k short remains open, the 80,500 shorts remain open, and the orders between 83-85k remain placed. The plan is simple, and discipline is everything. As long Bitcoin moves below 80k, I do nothing and just keep holding the shorts, once BTC allows to visit 83-85k my orders are waiting to be triggered. As long as the market gives us this gift, I take it. This is not the time to chase, not the time to flip bullish, not the time to listen to the noise on X. This is the time to position, wait, and let the market do what it has been preparing to do for months.
We are in the final stage of Stage 4 of my 6-stage bear market framework. ( Read about the Framework here: https://t.co/uV0f9x11kM) The exhaustion can be really felt, the sideways action is real, the frustration is real. This is exactly what Stage 4 looks like before the transition into Stage 5, the true capitulation phase. Stage 5 begins once we break below 60k, and from there the panic accelerates. Forced selling from long-term holders, exchange or large player collapse, black swan-type events, this is what Stage 5 brings. The 40-50k region remains my ultimate bottom target, with September-October 2026 as the most likely timeline based on my calculations
I see many messages of those who missed the 80-85k entries, I would not FOMO into shorts now, everything below 80k is a deadly area with a lot of volatility, the clear area for shorts is 80-85k, and this is what I am looking for since February. Markets never move in straight lines, and never believe the crash is happening quick, its always exhausting and destructive. People fail to understand this, especially those who believe its a good time to buy.
Calendar this week: The Fed's PCE inflation data was released Friday May 29th as expected. ISM Manufacturing PMI on Monday June 2nd, ADP Employment on Wednesday June 4th, and the big one, Nonfarm Payrolls on Friday June 6th. Any weakness in employment data combined with sticky inflation puts the Fed in an impossible position. Warsh's first FOMC as Chair is approaching in June, and markets are pricing in a dovish tone that I personally doubt will be delivered.
Summary:
Short from 115-125k fully open
Short from 79-82k filled, average entry 80,500
Remaining short orders at 83-85k still placed
71k long fully closed, profit realized last week!
Stage 4 nearing completion, Stage 5 starts on 60k break
Final bottom: 40-50k region, September-October 2026
SP500 shorts in a loss, but crash is loading
Nothing has changed since the call at 120k. The plan is the plan, the discipline is everything, and the patience is paying off. We are in the most important weeks of this bear market. Stay focused. Join the DrProfit Premium membership here: https://t.co/Ice9n2tMya
THIS IS NOT FINANCIAL ADVICE BUT EDUCATIONAL CONTENT ONLY.
So Much Money can be made with Altcoins:
Which low IQ always tells you to buy?
Ever thought about inverse buying?!
Buying Alts with x1 leverage Short
Very bullish on altcoin shorts!
#Bitcoin: These are the last days and if you are lucky the last few weeks above the 80k range, the area of 50k and below is calling and the big crash is a matter of time
Why the Stock Market Is Going to Crash:
Part 1: What the 1973 Oil Crisis Teaches Us:
The Big Sunday Report: Back in 1973, about 5–7% of the world's oil demand was cut off for roughly 5 months, and the consequences led to the worst crash in history since the Great Depression! Today, around 20% of the WORLD'S OIL DEMAND has been affected for 2 months, and there's no end in sight. This means the situation today is even worse than it was during the 1973 oil crisis, and yet most don't understand the pattern! This brings me to the question of how the $SPX (SP500) behaved then, and we need to compare it with now. In 1973, the #SPX crashed 20% as in October 1973 the Oil Embargo was announced. During that time, the S&P 500 was 7% away from its ATH, recovering from an earlier 17% correction, and the market was in strong euphoria believing in the next rally. Investors thought the worst was over, and out of the sudden the embargo hit the market and we saw a sharp drop of 20% that followed in October 1973. The same we saw in March 2026, the Strait of Hormuz was closed and the S&P 500 reacted with a 10% downside move. This is what I call the first shockwave, but what if I tell you that the real, and much worse downside move happened after the announcement of the end of the oil embargo was made ?
The oil embargo officially ended on March 17, 1974. This is when the real crash began, and the S&P 500 crashed 40% within the next 6 months! This was the worst crash since the Great Depression, and only 2008 was worse. The crash didn't happen during the embargo. It happened after the embargo was lifted, when everyone assumed things were going back to normal. The damage to the economy, the inflation, the higher input costs, the broken consumer, had already been done, and the market understood the damage and we see it today as well, as the parallel today is direct. The S&P 500 is making new highs while an oil supply shock is unfolding. Investors are doing exactly what they did in 1973: assuming the issue will resolve and pricing in a soft landing. But once the economic damage becomes visible in earnings and consumer spending, the same delayed reaction is likely to play out, and this is exactly what was addressed by Jerome Powell in the most recent FOMC meeting! Inflation is rising again, the FED can't ease anymore!
Part 2: The Private Credit and Banking Risk:
There's a type of investment fund called a private credit fund. These funds lend money to large companies, working a lot like hedge funds. The problem is that they borrow huge amounts of money themselves to make bigger loans and bigger profits. This is called leverage, and it's a double edged sword. When things go well, profits are programmed, but when things go badly, losses are programmed too.
The situation right now is alarming. Investors are pulling their money out at a record pace, with over $7 billion withdrawn from major private credit funds in late 2025. BlackRock has even blocked some investors from withdrawing money. Loan defaults are at record highs as well, with 5.8% of private credit loans in default as of January 2026, the highest level ever recorded! About 40% of the companies that borrowed from these funds are now burning more cash than they earn, and the stock market is starting to notice, with shares of big private equity and credit firms falling sharply. If these funds collapse, banks go down with them, because banks lent them much of the money in the first place. So what happens if banks fail? Since the 2010 Dodd-Frank Act in the U.S. and the 2014 EU bank rescue rules, governments are no longer supposed to bail out failing banks with taxpayer money. Instead, they use something called a bail-in. They take money from depositors and bondholders and turn it into bank shares. The result is that bank stocks crash and ordinary people lose part of their savings. This is why physical gold and silver are the only real safe haven. I consider owning them a MUST.
The Main Warning Signs
The first and most important is oil. In 1973, oil first moved up, and the stock market crash came after the Arab nations reopened oil supply. The damage was already done. What we're seeing now in the S&P 500 looks like the final push higher before the expected crash. History is repeating itself. The second is the yield curve inversion. This happens when short-term interest rates rise above long-term rates, which is a clear warning sign. It has come before every U.S. recession in the past 50+ years, usually 12 to 24 months in advance. Back in 2025, I wrote a full report pointing to June 2026 as the likely crash zone, and the report was written in September 2025 and can be found here: https://t.co/zmp7L8Yi8c
The third is insider selling at record speed. Company executives and big shareholders have been dumping their own stock at a pace never seen before, especially since August–September 2025. When insiders are selling this aggressively, it tells you everything you need to know and thats something I observe since many months!
The fourth is extreme risk appetite, and right now it's at its highest point since 2021. In simple words, risk appetite means how much investors are willing to bet on risky things like stocks instead of keeping their money safe. Right now, investors are throwing money into risky assets like never before. According to EPFR fund flow data, risky assets have seen record net inflows exceeding safe assets by 220bn over the last 4 weeks, the strongest since the 2021 meme-stock peak. To put it simply, people are pouring much more money into stocks than into safe places, and the gap is the biggest we've seen in years. This also aligns with updates to S&P Global's Investment Manager Index risk appetite gauge and Goldman's proprietary RAI, both hitting multi-year highs. This is the same type of euphoria we saw right before the 2021 top, and history shows that when everyone is greedy and chasing the market at the same time, the top is usually very close and this is the moment when risk appetite is this extreme, it's a clear warning sign, and trust me, you dont want to be among the losers who bought the top!
The 1929 Parallel: Why You Need to Study the Great Depression
Study the Great Depression of 1929, and I can't repeat it often enough. Study it, you need to study 1929! You will notice many similarities. The people who owned physical gold and silver back then were the big winners. Land was sold for even one penny because there was no liquidity at all. Farmers had tons of wheat but there was no one able to buy it. The US President Herbert Hoover famously said right before the great depression, "Prosperity is just around the corner," talking about the stock market and its bullish movements and claiming that nothing could stop the upside move. Everyone in the US was invested in stocks back then, the same as today, as record amounts of retail investors are sitting on stocks currently, the highest amount of retails ever recorded. Now, a hundred years later, we have another president talking about the stock market like no one else. Trump is talking about being tired of winning, or calling it the best economy ever based on the stock market, and ignoring the real economy that is suffering and has no liquidity to breathe currently. I see tons of similarities, and I am scared to even speak it out, but my biggest concern is a repeat of the Great Depression. I am not a doomsday caller, but I am here to remind you that physical gold and silver are more important than ever, no matter what the price says.
My Trade and My Targets
Let me be clear about where I stand. I am not just talking, I am positioned. I have shorted the S&P 500 at 6400, 6700, 6900, and 7100, and my final order remains open in the 7400 region if the market gives us that opportunity. In my view, we are deep inside top territory, and I am placing my shorts right here, right now, for every single reason laid out above. The signs are everywhere. Spotting the top is not the hard part, anyone paying attention can see it. The hard part is pinpointing the exact target on the way down, because that depends entirely on one thing: will the FED print again? And the answer that history teached us is simple. The FED only starts to print once a crisis hits, and now lets ask the same for 2008, where the FED wasnt able to print more money, and the Lehman crisis and the 2008 crash started and how likely is it in the current time ?
In 2008, the FED did not intervene to save Lehman Brothers. Everyone expected a rescue, everyone assumed the FED would step in like it did with Bear Stearns just months earlier. But the FED let Lehman fail, the bank went bankrupt, and the entire financial system nearly collapsed with it. That single decision changed everything. It triggered the worst financial crisis since the Great Depression, and it is the exact reason the bail-in laws I mentioned earlier even exist today. Dodd Frank in the US and the EU bank rescue rules were both born directly out of the chaos of 2008, designed so that taxpayers would never again foot the bill. Next time, depositors and bondholders pay, and this is where the real risk hits the ordinary person. In simple words, if your bank fails, the government will not save it with taxpayer money like in 2008. Instead, the bank takes a part of your savings, anything sitting in your account, and converts it into worthless bank shares of the failing bank. Your money is gone, replaced by stock in a bank that just collapsed. In the EU, deposits up to €100,000 are technically protected by deposit insurance, and in the U.S. up to $250,000 by the FDIC, but anything above that is fair game, and history has already shown us this is not theory. It happened in Cyprus in 2013, where depositors lost a huge chunk of their savings overnight, and this will let the fire of the crash expand.
So for my targets, I see three realistic scenarios, and they all depend on the FED:
Scenario 1: The FED panics and prints again. If inflation cools enough to give them room, they flood the system with liquidity, and the crash is contained to a sharp but limited drop. This is the most "comfortable" outcome for the market.
Scenario 2: The FED is trapped by inflation and cannot print. With inflation rising again, as Powell himself just confirmed, the FED may have its hands tied. No money printing, no rescue, and the market bleeds out for months. This is the painful, drawn-out scenario.
Scenario 3: A full 2008-style collapse. The FED lets something break, just like they let Lehman break, and the entire system cracks open. Bail-ins get activated, banks fall, savings get wiped, and the SP 500 sees a crash on the scale of 2008 or worse. This is a very real option, and I refuse to take it off the table.
I am positioned for all three, and depends on the targets the probability that we are at top area is extreme high. The only question left is how deep the FED is willing to let this fall, and based on inflation, based on Powell's own words, and based on the political climate, I believe the risk of scenario 2 or 3 is far higher than the market is currently pricing in. The top is in, or it is extremely close. I am short, and I am staying short with an invalidation once the FED starts printing once again!
The next weeks will be very important and many will miss out on real time updates and thats where premium is worth everything. It costs $59 / month and thats less than some of the trading fees you are paying! I cant repeat it more often but premium offers insights you are getting no-where else. Join here: https://t.co/kcREa27FtQ
No one expected $80,000 weeks ago
I was the only one who said 80k is coming
Thanks for listening and taking the 71k long!
I am aiming for 83-85k region as next target
Only a loser is shorting at extreme fear
Only a loser shorted in the last 1-4 weeks
The crash is coming with euphoria, not fear!
Preparing for 82-85k, before the big crash!