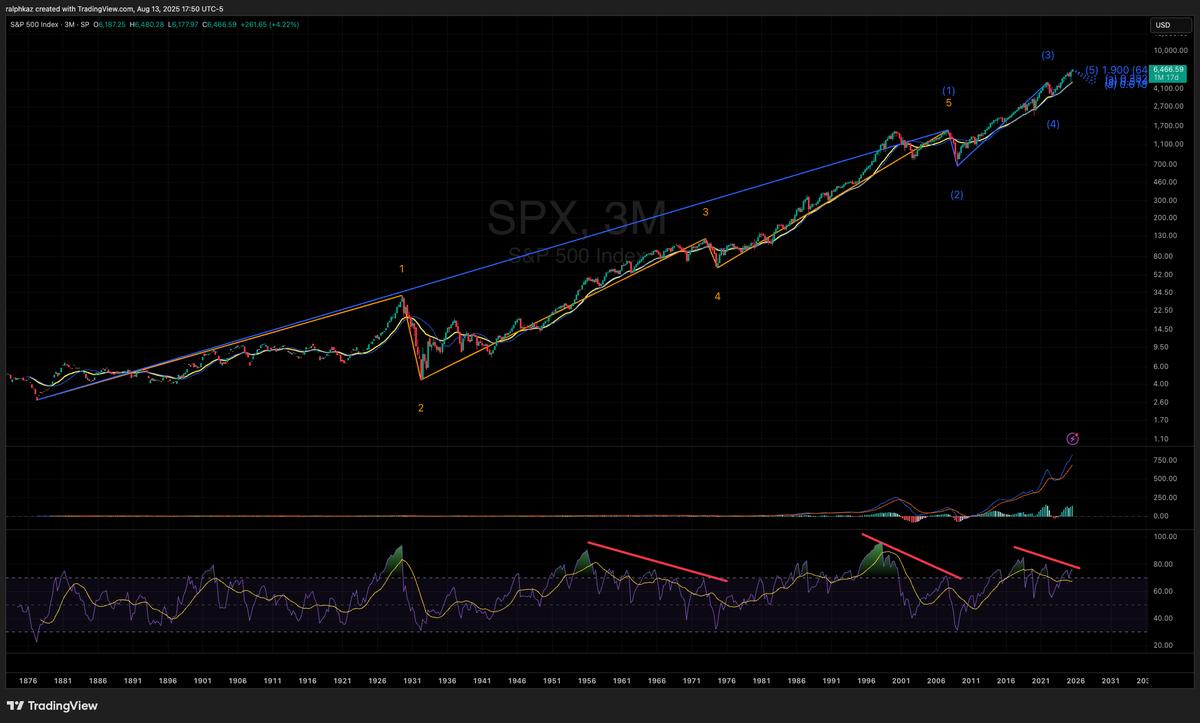
Some fun with the tradingview Elliott Wave auto indicator... It seems to think $SPX is in the final wave of the grand supercycle. RSI divergences would agree... So top could be today or perhaps in 5 yrs... Nobody knows. $ES $SPY
$AMD I am reminded that I give away too much on X but for me, everyone deserves to make money and everyone needs to start somewhere.
I know from personal experience that I benefited greatly from the free content that I received from X and I hope I am somewhat paying it back now.
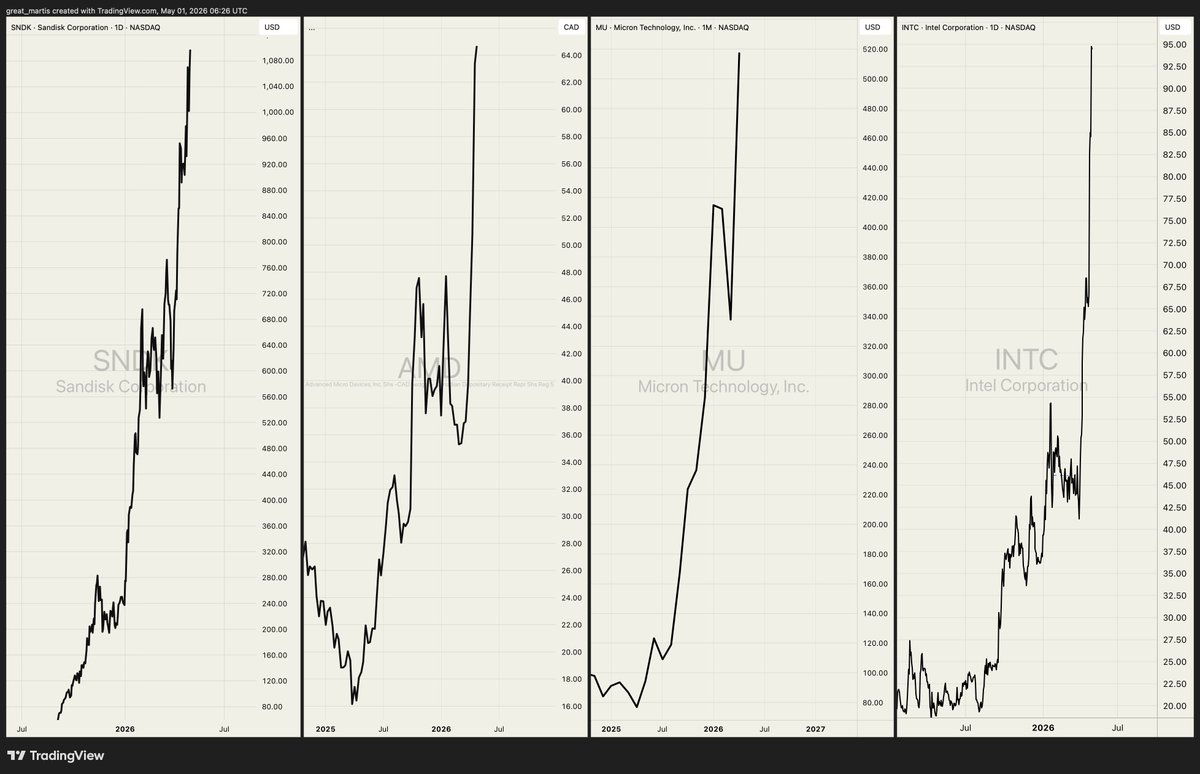
Nvidia has officially reached its highest deviation above its mean price ever.
From a regression perspective, it's now in a bigger bubble than it was at the peak of the Dotcom Bubble.
#Nvidia / #NVDA / $NVDA / #Mag7 / #Megacap
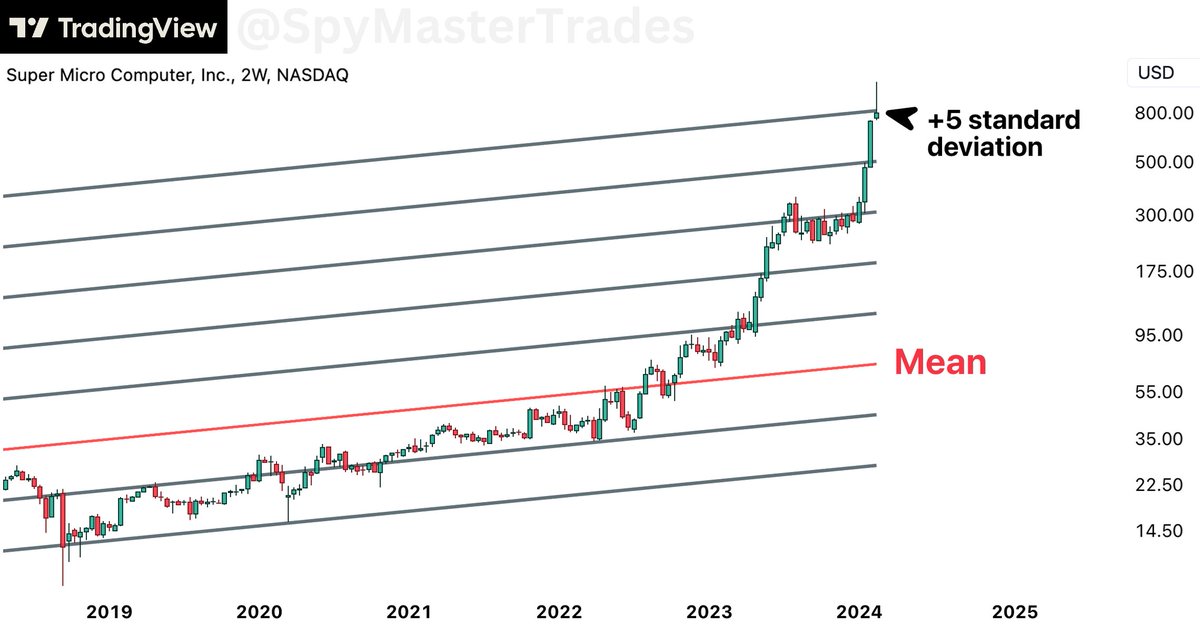
$SMCI reached the +5 standard deviation on its log-linear regression channel.
This extent of price over-extension is extraordinarily rare and tends to only occur in the peak phase of an asset bubble. When a reversal candlestick occurs at such high deviations from the mean, it is a major warning sign.
Such high deviations above the mean are caused by a stock-buying mania and/or a short squeeze, which causes the price to explode higher due to positive feedback loops.
When the price finally begins to revert back to the mean, this manifests as the popping of a bubble and can result in a catastrophic loss for those who entered near the top using leverage without proper risk management.
Indeed, most market crashes are merely log-scale reversions to the mean. Nonetheless, over the long term (years), price tends to recover and eventually reach new all-time highs in large part because of the effects of a perpetually exponentially increasing supply of fiat currency.
February's S&P 500 closing price marked the 8th-highest deviation above the historical mean for monthly closings.
This level is about as overextended from the mean as the peak of the Dotcom Bubble and the 2022 market peak. It is also considerably higher than the 1929 stock market peak that preceded the Great Depression.
The last time the U.S. stock market reverted to its long-term mean was during the Great Recession.
Note: This analysis was done using log-linear regression.
Adjustment: The $SPX fractal pattern & $NDX burst now suggest the b-wave rally is still progressing.
$SPX is now expected to pop to 4812-4830, before reversing lower.
This delays the sharp decline, targeting 4620-4585, by early February.
$ES_F $SPY $NQ_F
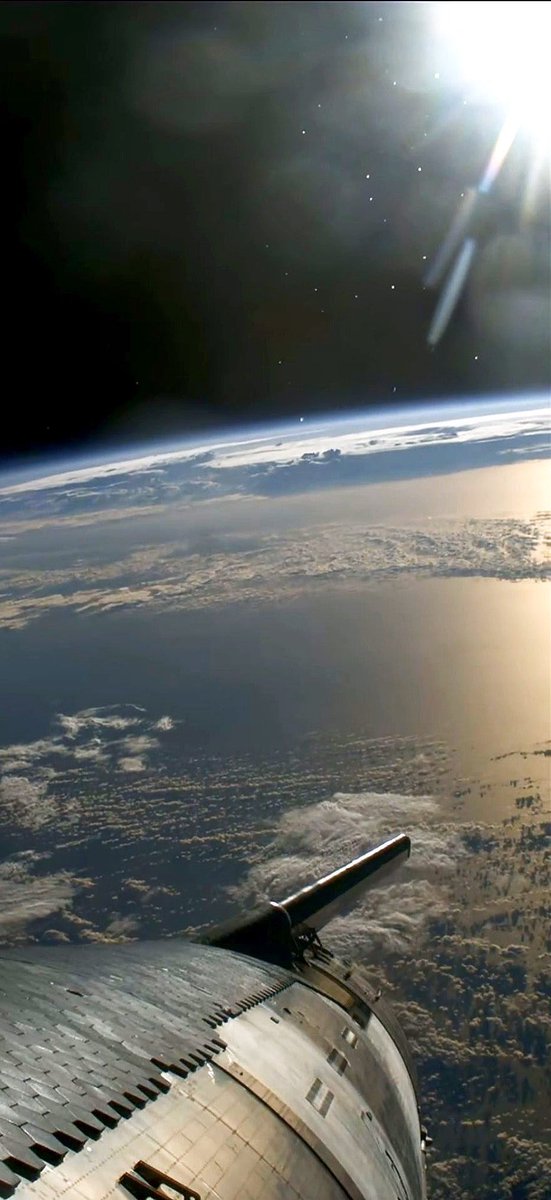
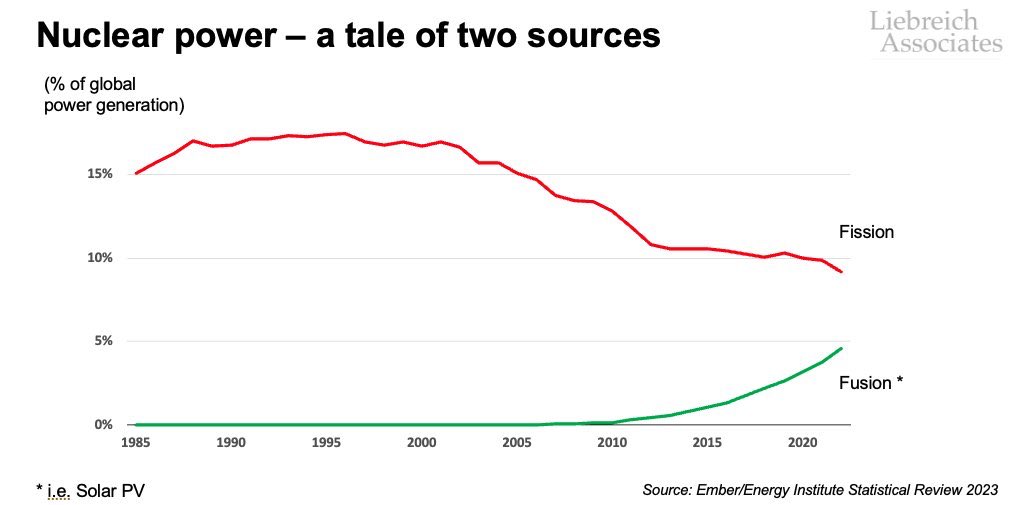
Earth already receives about the same energy from the Sun in an hour than humanity consumes in a year.
Solar panels just need to catch a tiny amount of it to power our entire civilization!
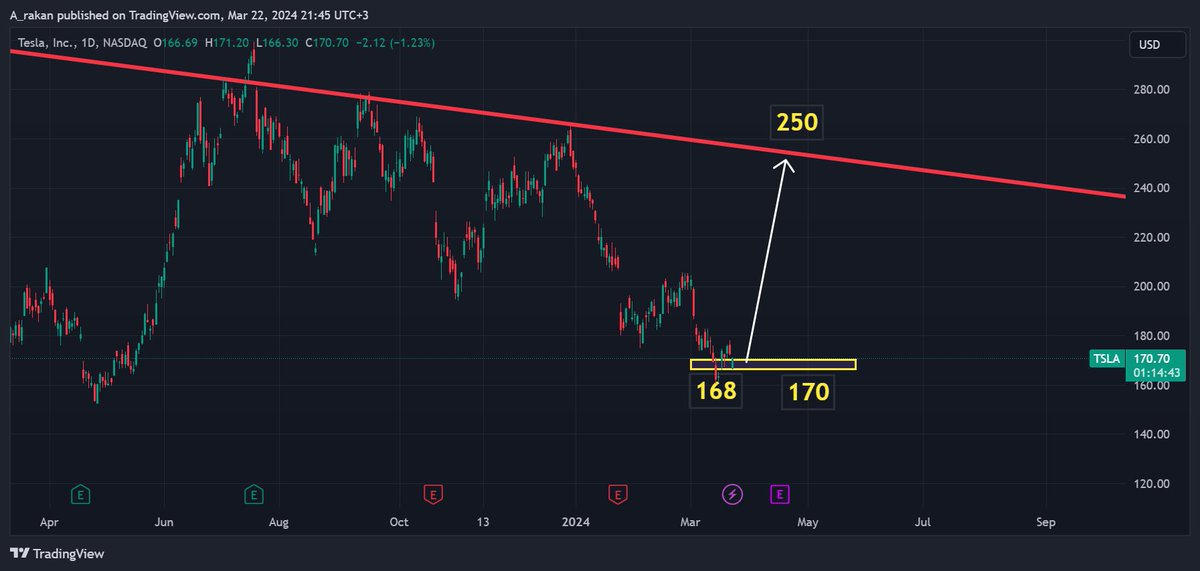
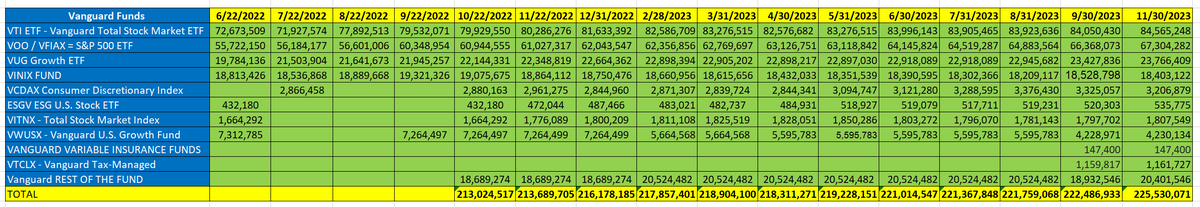
$TSLA #TSLA = BREAKING: Vanguard Bought More TESLA Shares!
Vanguard Continue to BUY more Tesla Shares!
- NOW OWN = 225,530,071 Total Tesla Shares!
- PREVIOUS = 222,486,933 Total Shares.
- Increase = 3,043,138 Shares!
Retweet for Maximum Exposure Please.