All content by @satonacci is strictly informational and educational only, NOT personalized financial advice or recommendations. I'm not a registered adviser. Investing involves risk. I may hold positions in assets discussed. Always consult a licensed professional.
Mapped 100+ years of S&P 500 drawdowns using Fibonacci levels.
The alignment with past crises is… uncomfortable.
Markets may be chaotic but corrections are not random?
$SPX #SP500
https://t.co/nXjghB9eiM
#SP500 It looks like the market may choose a direction soon.
Just because a pattern worked in the past doesn’t mean price will follow it again in the future. Over time, 99% of chart patterns are largely random.
Let’s see 🙂
@PeterLBrandt Well... If this time it will not be different and you are right, we are at the early stage of the bullmarket?
👀
#XAG#Silver
https://t.co/mKBmAzcqiw
@PeterLBrandt Well... If this time it will not be different and you are right, we are at the early stage of the bullmarket?
👀
#XAG#Silver
https://t.co/mKBmAzcqiw
#FLRUSD Flare (#XRP)
Bullish vs Bearish Scenario
Bullish Scenario:
FLR appears to be completing a Wave 4 correction within a broader impulsive structure. Price is consolidating near the 0.382–0.618 Fibonacci support zone, which is typical for Wave 4 behavior, which is around $0.08 and $0.0002.
Notice the reaction at 0.382 retrace (black arrow)
Holding this area would favor the start of Wave 5, implying that the macro bottom may already be in and that higher prices could develop over the coming years.
Bearish Scenario:
Alternatively, the full 5-wave structure may already be completed, with the current price action marking the beginning of a larger Wave 2 correction.
A breakdown below the current support zone would increase the probability of a prolonged bearish phase, potentially unfolding over several months or years, with risk of much lower prices, even to $0
#XRP Bullish vs Bearish Scenarios
Bullish Scenario:
The market is currently completing Sub-Wave 2 of Major Wave 5 (within the 1-2-3-4-5 structure).
The potential price range for this corrective phase is between $0.55 and $1.89.
If this scenario plays out, it would imply that the market bottom may already in, with the next major upside target projected around $22 over the coming years.
Bearish Scenario:
All five major waves may already be completed, meaning the market has entered a broader corrective phase.
In this case, price could retrace into a range between $0.55 and $0.04.
Such a corrective move would likely unfold over several months, or even years, before a new long-term trend emerges.
@LSDinmycoffee It does not matter, everyone knows Anatoly. The question is how much do we want to believe in it?
Ask the right question and you will get the right answer...
:)
Is AI/Humanoids Inflationist or Deflationist?
Inflation isn’t a law of nature — it’s a bias created by living through one extraordinary century.
For decades, investors assumed rising prices, rising equities, and “cash is trash” were universal truths.
But this viewpoint is heavily shaped by recency and survivorship: the post-WW2 boom, the fiat era, and the U.S. demographic explosion. When we zoom out, history shows long stretches of flat or falling prices, decades where equities underperform cash, and entire nations (like Japan since 1990) where deflation becomes the dominant regime.
AI and humanoid robots now introduce the strongest deflationary force since the Industrial Revolution.
Zero-marginal-cost labour, infinite scalability, collapsing production costs, and exponential productivity growth all naturally push prices downward. In such an environment, corporate margins can compress, valuation multiples can fall, and equity returns can stagnate even as real output increases. This creates the conditions for a “Japanification” scenario across the developed world: low inflation, mild deflation, and multi-decade periods where cash and high-grade bonds with positive real yields outperform equities.
Governments may attempt to fight deflation to protect their debt loads through fiscal expansion and monetary easing. But strong technological deflation can absorb stimulus without generating inflation, exactly like Japan has experienced for over 30 years.
The contrarian possibility is clear: physical goods and many services become cheaper, real returns on cash rise, long bonds regain dominance, and equities struggle despite technological progress. This isn’t fantasy — it’s a coherent macro regime, supported by historical precedent and the structural forces now accelerating through AI and robotics.
Think again. If you flip a coin and it lands on tails five times in a row, you don’t conclude that “tails is the new normal.” You’re just witnessing a temporary streak inside a binomial process — and over time, outcomes tend to revert toward 50/50. Inflation works the same way: a long run of inflation doesn’t prove that rising prices are the permanent state of the world; it may simply be one extended streak in a much larger cycle. And the next dominant cycle could just as well be deflation – and deflation is ugly.
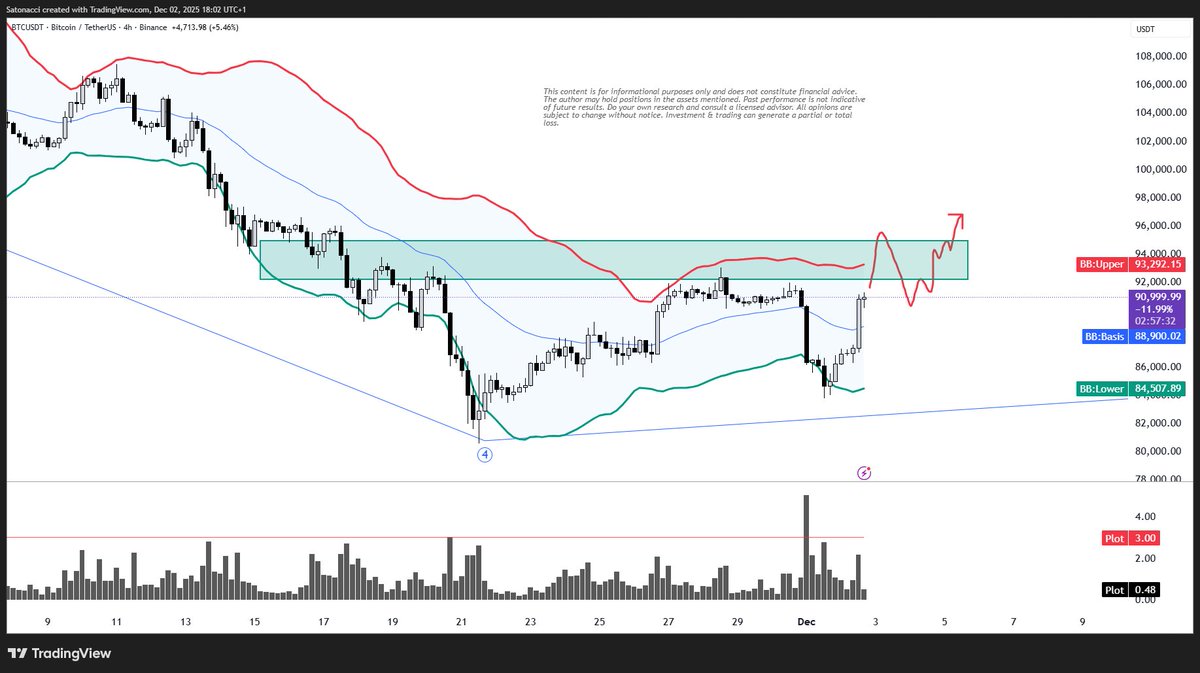
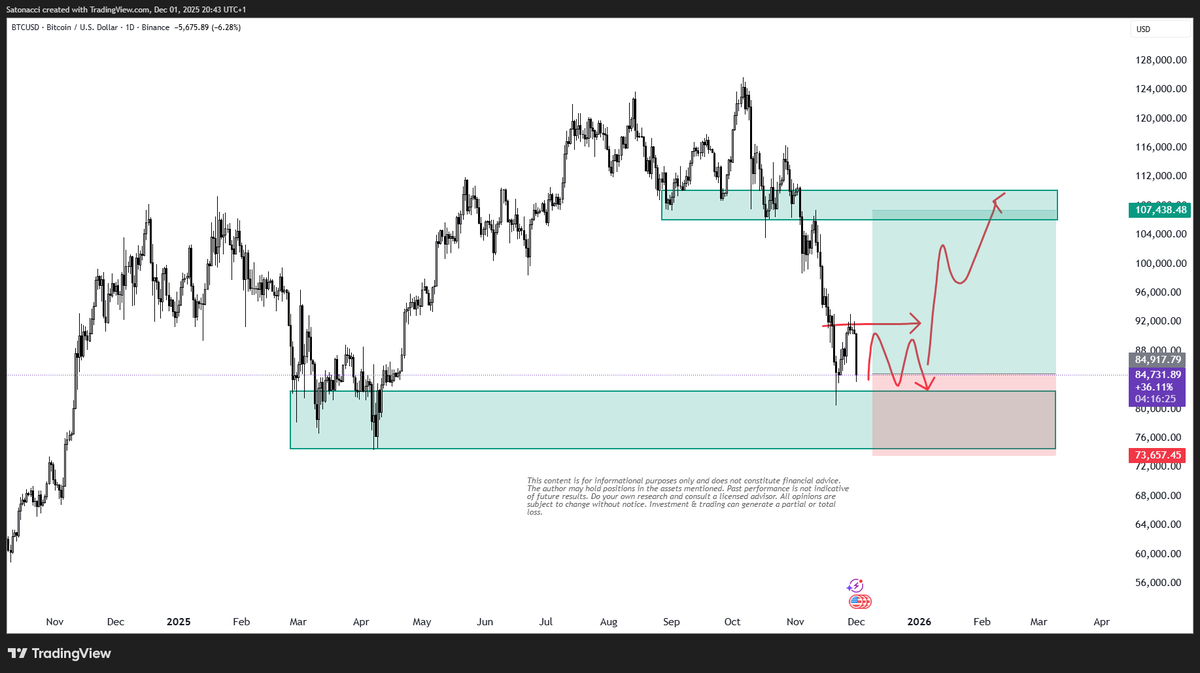
#BTC has retraced at 0.382, which is around $83000
Based on my EW count, it could be the bottom and market should target Higher High and price discovery toward $140000 ++
However,
If price reaches around $70000 this scenario is invalid.
This is another animal. Let's see?