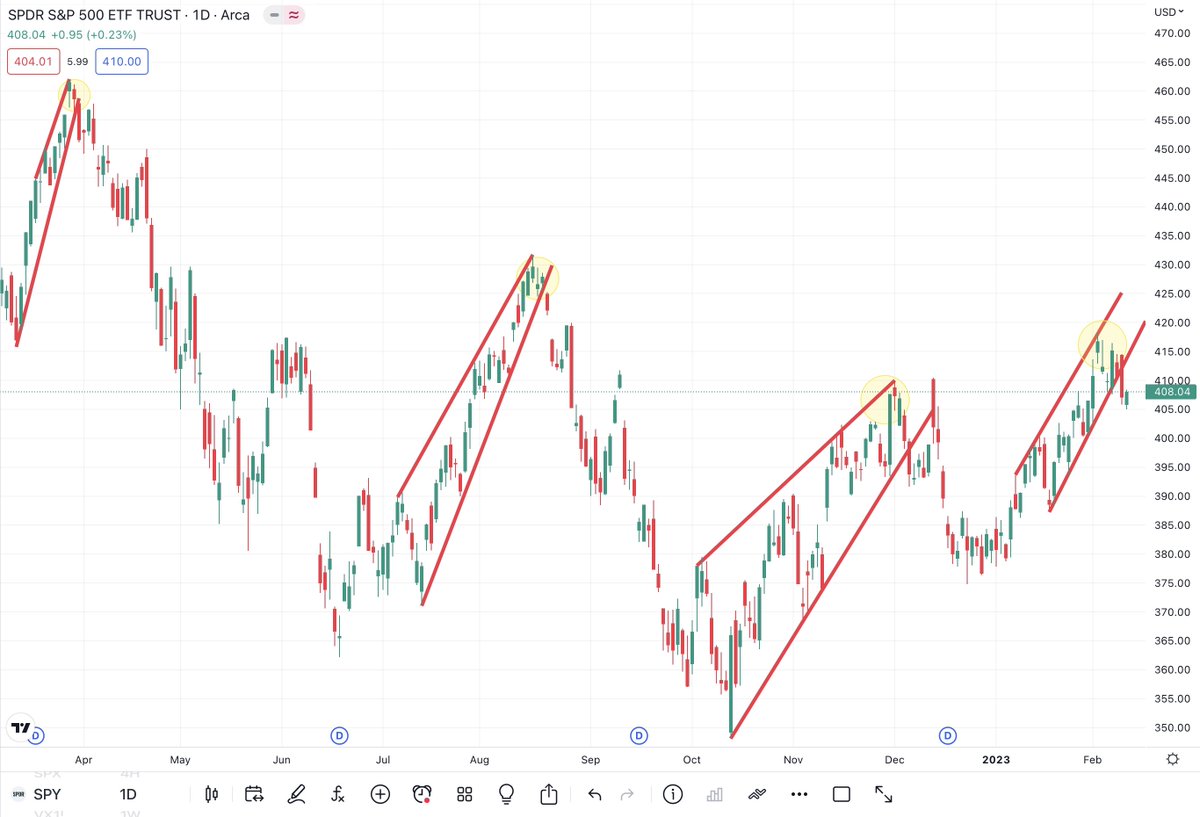
$SPY Weekly Chart 📈📉 Update 🧵
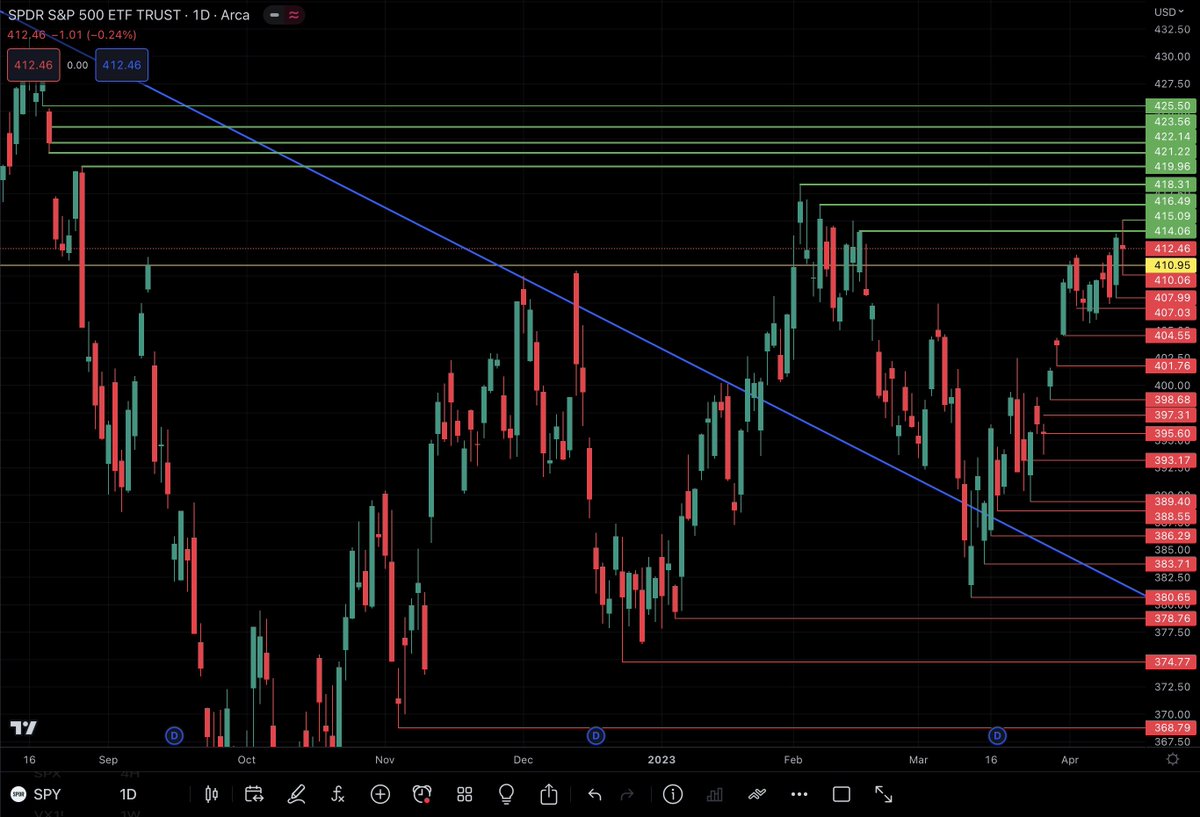
Starting with the Daily Chart:
Do we have the juice to takeout the 2022 high on Feb 2nd $418.31?
Or is this rising wedge 🧀getting tired?
$SPY Weekly Chart 📈📉 Update 🧵
Last Week:
Open $390.80
High $402.49
Low $388.40
Close $395.75
Range 3.36%
Gain 1.48%
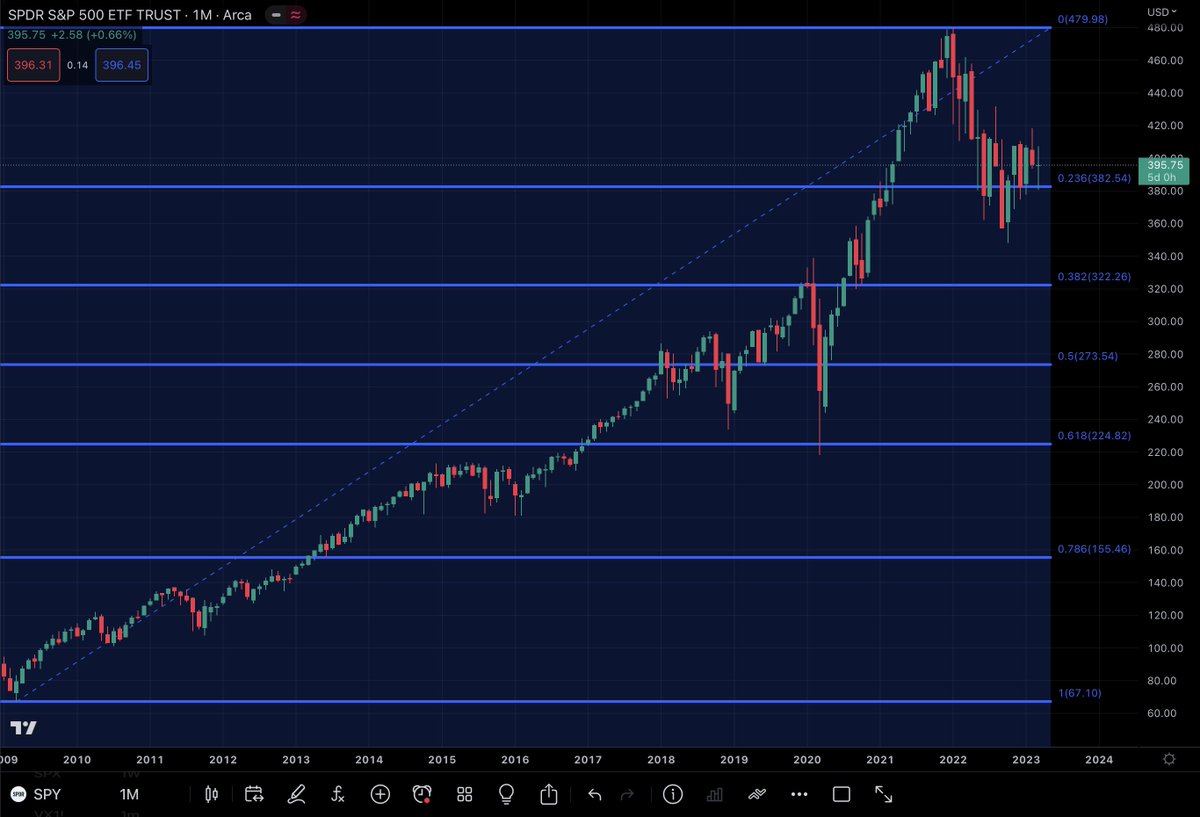
Monthly Chart: needs $402.50 or $380.65 to break TL. Will it ever break and hold $412 level?
Holding above 9MA for now
Above .236 Fib
$SPY FOMC rate decision Wednesday 2PM Eastern 👀
Will the Fed raise .25, .50, or Pivot?
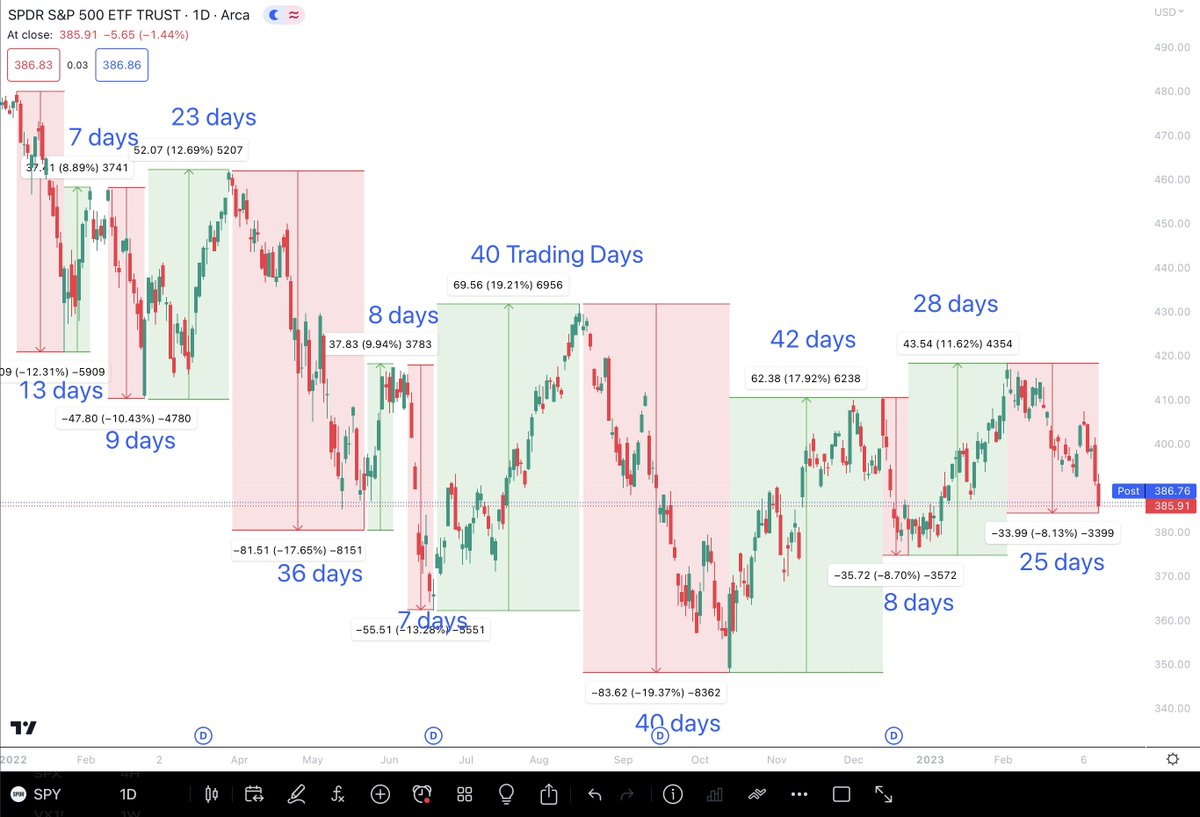
First chart, QT rate hikes and reactions
Second chart, break of major TL and push up into February 2nd due to pivot hopes
Third chart, downtrend since Feb 2nd hike
How will this week go?
$SPY Weekly Chart Update 🧵 🚨🚨🚨
Last week:
Open: $399.87
High: $404.45
Low: $392.33
Close: $404.19
Gain of 1.97%
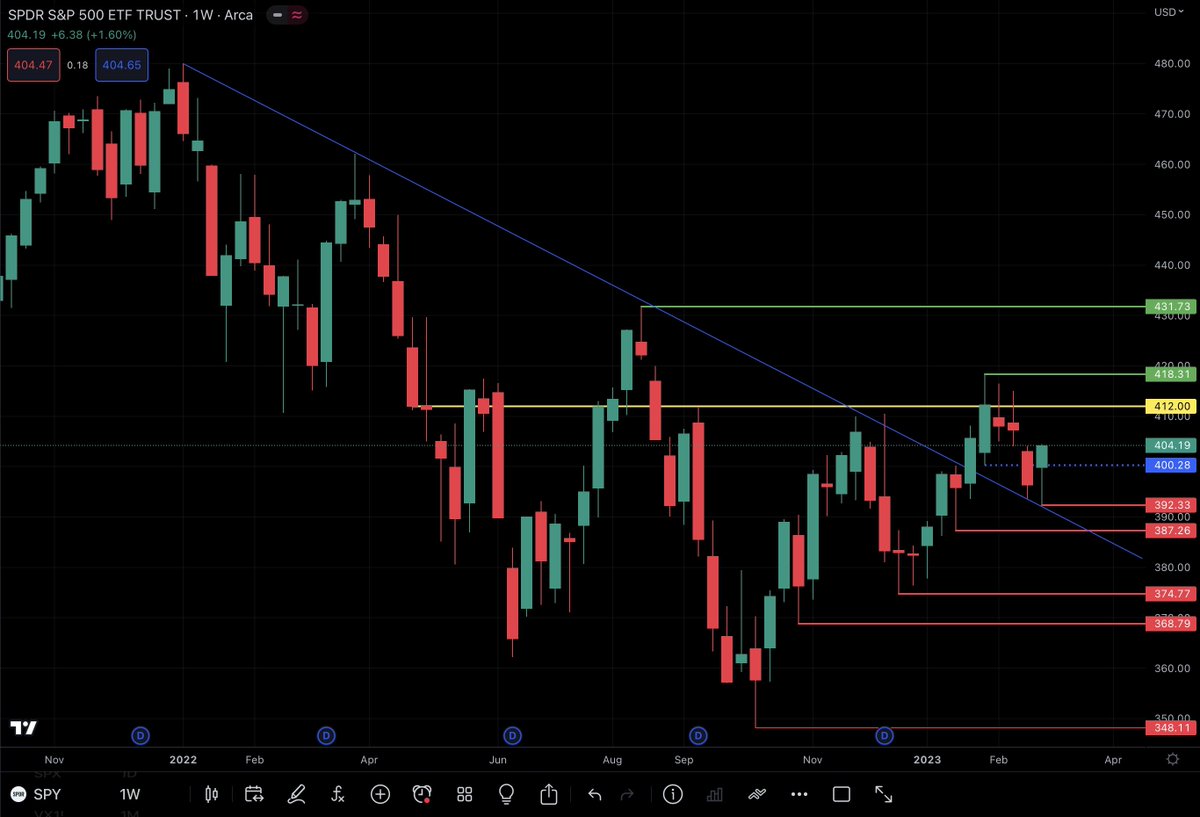
Starting with the Weekly Chart, we saw a retest of the blue ATH TL. Bounce and close with a weekly hammer candle
Will we see another test of that $412 level?
4 revelations reviewing my trades:
1- meditate for 20 minutes .
2- trading the first 2 hours should be enough.
3- if a trade turns on u, only leave if u see a volume spike on 1 minute, otherwise play the TF+setup.
4- scalp 20% 10 days out options, that'll keep emotions in check
$SPY Weekly Chart 📈📉 Update 🧵 🚨🚨🚨
This week I am providing a different perspective than normal.
Last Week:
Open: $409.79
High: $416.49
Low: $405.01
Close: $408.04
-1.05% for the week
First chart, seems we’ve seen this setup before
CPI Tuesday….