Stop hunting for trades. Let the data find them for you.
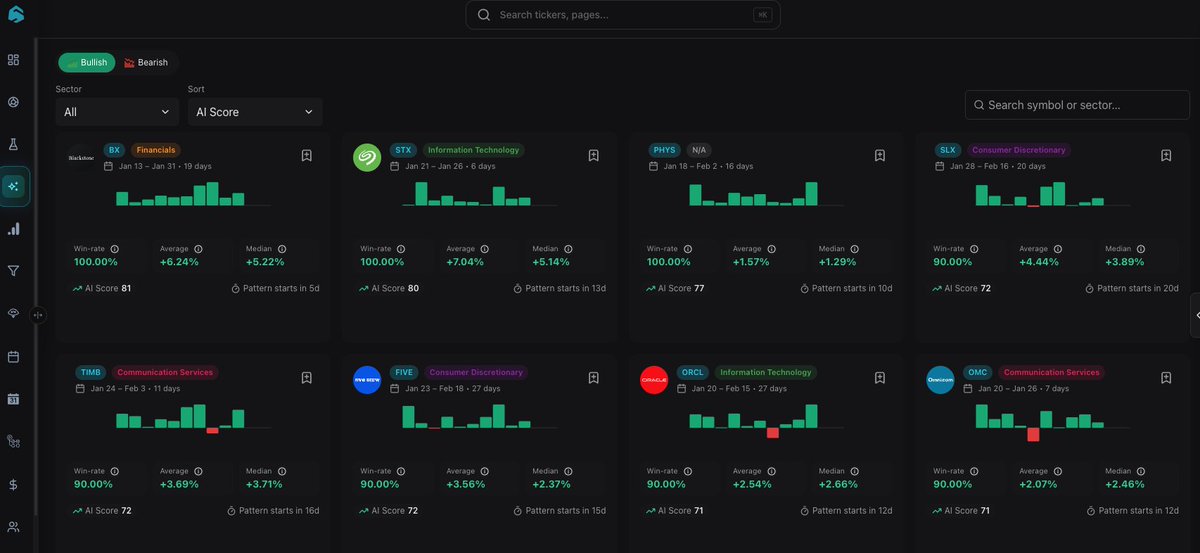
Our AI scans the entire market daily to uncover high-probability seasonal setups. You receive a curated feed of up to 50 bullish and bearish patterns EVERY SINGLE DAY.
Finding a trade with a mathematical edge used to be hard. Now it’s automatic.
Try it today at https://t.co/VeFsfjoRyB
🟢 $PLTR seasonal window is open.
📅 May 11 → Aug 14
🏆 Win rate: 100% (5W / 0L)
📈 Avg winner: +46.96%
⚡ Annualized: 175.00%
🛡️ Sharpe: 6.10 | Volatility: 12.48%
Best year: +59.11% Zero losses — every single year a winner.
Low risk, high reward — the bulls have dominated here every year. 🐂
Not financial advice. DYOR. 🧠
🟢 $IBM seasonal window just opened.
📅 May 19 → Jun 10
🏆 Win rate: 100% (10W / 0L)
📈 Avg winner: +3.64%
⚡ Annualized: 57.66%
🛡️ Sharpe: 4.85 | Volatility: 2.49%
Best year: +7.96% — zero losses across 10 years.
While everyone's chasing momentum plays, $IBM has been quietly printing every single May-June window for a decade straight.
Not financial advice. DYOR. 🧠
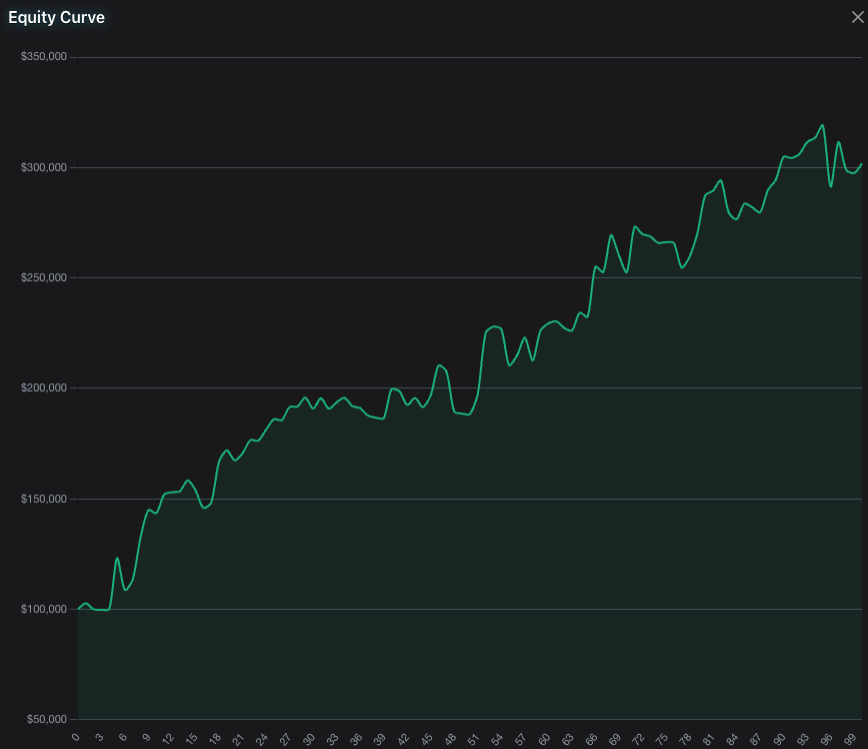
🚨 $ONDS seasonal pattern is LIVE right now
May 13 → Jul 23 has been one of the most reliable windows in the small-cap space:
✅ 80% win rate over 5 years
📈 Mean return of 57.38%
🏆 Best year: +152.40%
📉 Worst year: −25.00% (only 1 loss in 5)
⚡ Annualized: 285.22%
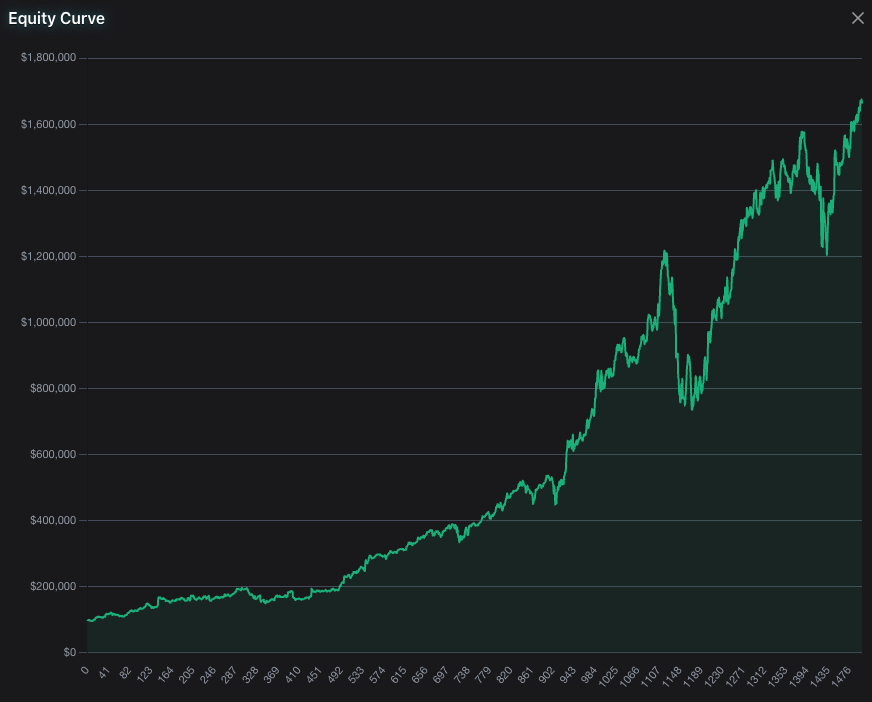
The equity curve tells the whole story — slow grind up, then a steep rip into summer.
Not financial advice. Do your own DD. But the seasonality here is hard to ignore. 👀
🟢 $TTWO — Take-Two Interactive has a flawless seasonal setup RIGHT NOW.
📅 Window: May 8 → Jun 8
🏆 Win rate: 100% over 10 years
📈 Avg return: +9.66% in ~1 month
⚡ Annualized: 108.68%
🛡️ Sharpe ratio: 4.55 (volatility only 5.96%)
10 gains. 0 losses. Not a single red year.
Best year: +21.92%
Worst year: still +1.90% 🤯
Not financial advice. DYOR. 🧠
🟢 $PLTR seasonal window is open.
📅 May 11 → Aug 14
🏆 Win rate: 100% (5W / 0L)
📈 Avg winner: +46.96%
⚡ Annualized: 175.00%
🛡️ Sharpe: 6.10 | Volatility: 12.48%
Best year: +59.11% Zero losses — every single year a winner.
Low risk, high reward — the bulls have dominated here every year. 🐂
Not financial advice. DYOR. 🧠
Just do it? History says 'Just Don't' when it comes to buying $NKE right now 📉👟
If you are looking at the next two weeks (Feb 25 - Mar 9) over the last 10 years, betting on the swoosh has been absolutely brutal:
🔴 10% Win Rate (10 years of data)
🔴 1 Win vs. 9 Losses
🔴 -4.00% Average Return
🔴 -9.46% Worst Loss
The historical equity curve for this specific window is practically a waterslide. Even the singular winning year over the last decade barely scraped by with a +0.30% gain.
Are you shorting the rally or staying away entirely? 👇
🟢 $HIMS seasonal window is open.
📅 May 11 → Jun 7
🏆 Win rate: 83% (5W / 1L)
📈 Avg winner: +31.66%
⚡ Annualized: 319.38%
🛡️ Sharpe: 2.54 | Volatility: 28.50%
Best year: +69.16%
Only loss: -13.34%
High risk, high reward — but the bulls have had the edge here every year except one. 🐂
Not financial advice. DYOR. 🧠
🟢 $TTWO — Take-Two Interactive has a flawless seasonal setup RIGHT NOW.
📅 Window: May 8 → Jun 8
🏆 Win rate: 100% over 10 years
📈 Avg return: +9.66% in ~1 month
⚡ Annualized: 108.68%
🛡️ Sharpe ratio: 4.55 (volatility only 5.96%)
10 gains. 0 losses. Not a single red year.
Best year: +21.92%
Worst year: still +1.90% 🤯
Not financial advice. DYOR. 🧠
🟢 $GRVY — one of the cleanest seasonal setups on the market right now.
📅 Window: May 8 → Jun 4
🏆 Win rate: 100% over 10 years
📈 Avg return: +18.28% in ~4 weeks
⚡ Annualized: 238%
🛡️ Sharpe ratio: 5.70 (volatility only 9.62%)
10 for 10. Every single year. Never had a losing trade in this window.
Best year: +31.38% Worst year: still +3.29% 🤯
$AMZN has an absolute powerhouse of a seasonal setup heading into the spring and summer. 📈
If you look at the historical window from the first week of March through the end of July (Mar 6 - Jul 29), the data is overwhelmingly bullish:
🟢 87% Win Rate (15 years of data)
🟢 +21.12% Average Return
🟢 +59.57% Max Gain
🟢 13 Wins vs. Only 2 Losses
The historical equity curve for this exact 5-month window is practically up and to the right. While tech can always be volatile, history shows that betting against Amazon during this specific stretch has been a heavily losing game for the last decade and a half.
🚨 Wild seasonal stat for $QQQ:
For 14 years in a row—even through bear markets—the Nasdaq 100 has been GREEN over the next 5 months (Mar 11 to Aug 16).
✅ 100% Win Rate
📈 +12.24% Average Return
🚀 +39.41% Best Return
Will the streak hold up again this year?
🚨 $TSLA's most explosive seasonal window starts NEXT WEEK
If you started with $100k and ONLY traded Tesla from Mar 16 to mid-Aug over the last 15 years... your account would have 70x'd to over $7,000,000 🤯
The track record for this exact 5-month stretch:
✅ 87% Win Rate
📈 +50.57% Average Return
🎯 +15.29% Median Return
🚀 +312.10% Best Year
Will the seasonality strike again this year?
🚨 Perfect 10-year seasonal streak for Ferrari ($RACE) starts TODAY. 🏎️💨
From March 10 to August 30 over the last decade, $RACE has NEVER been red during this 5.5-month stretch
✅ 100% Win Rate (10 for 10)
📈 +21.88% Average Return
🎯 +17.43% Median Return
🚀 +74.35% Best Year
🛡️ +1.28% Worst Year (Still green!)
Will the ultimate luxury stock keep its flawless streak alive this year?
🚨 $TSLA's most explosive seasonal window starts NEXT WEEK
If you started with $100k and ONLY traded Tesla from Mar 16 to mid-Aug over the last 15 years... your account would have 70x'd to over $7,000,000 🤯
The track record for this exact 5-month stretch:
✅ 87% Win Rate
📈 +50.57% Average Return
🎯 +15.29% Median Return
🚀 +312.10% Best Year
Will the seasonality strike again this year?
🚨 $TSLA Bulls Beware: The "Dead Zone" starts today
History says Tesla is about to have a rough month. Starting Tomorrow (Feb 17), the stock enters a seasonal window where it has lost money for 9 years in a row.
The 10-Year Data (Feb 17 – Mar 17):
❌ Win Rate: 10% (1 Win, 9 Losses)
📉 The Streak: Red every single year since 2016.
💸 Avg Drop: -10.82%
💀 Median Drop: -11.31%
🚨 Wild seasonal stat for $QQQ:
For 14 years in a row—even through bear markets—the Nasdaq 100 has been GREEN over the next 5 months (Mar 11 to Aug 16).
✅ 100% Win Rate
📈 +12.24% Average Return
🚀 +39.41% Best Return
Will the streak hold up again this year?
Pivoting from the explosive moves in Gold to something a bit more defensive... but with an incredibly consistent seasonal edge. ⚡🛡️
Let's look at WEC Energy Group ( $WEC) in the Utilities sector.
If we scan the next two months (March 2nd to May 5th) over a massive 15-year lookback period, the quantitative setup is extremely compelling. 📊👀
Here is the historical breakdown for this exact 9-week window: 🗓️🔥
🎯 Win Rate: 87% (13 winning years, only 2 losses)
🚀 Average Return: +5.62% (with a median of +6.65%)
💥 Maximum Gain: +16.30%
⚖️ Profit Factor: A staggering 7.71
Utilities are generally known for lower volatility, but finding a 2-month window with nearly a 90% historical hit rate across a decade and a half is a massive structural anomaly. A Profit Factor of 7.71 means the historical gains drastically outweigh the historical drawdowns during this period. 📈💰
Is March the ultimate seasonal window for Gold Miners? ⛏️🥇
Looking at the historical seasonality for AngloGold Ashanti ( $AU), the data points to a highly compelling bullish setup right now.
If we isolate the trading window from March 2nd to March 26th over the last 10 years, the historical performance is staggering:
🎯 Win Rate: 100% (10 consecutive years of gains)
🚀 Average Return: +8.69% in just over three weeks
💥 Maximum Gain: +28.60%
🧠 Risk-Adjusted: A massive Sharpe ratio of 3.22
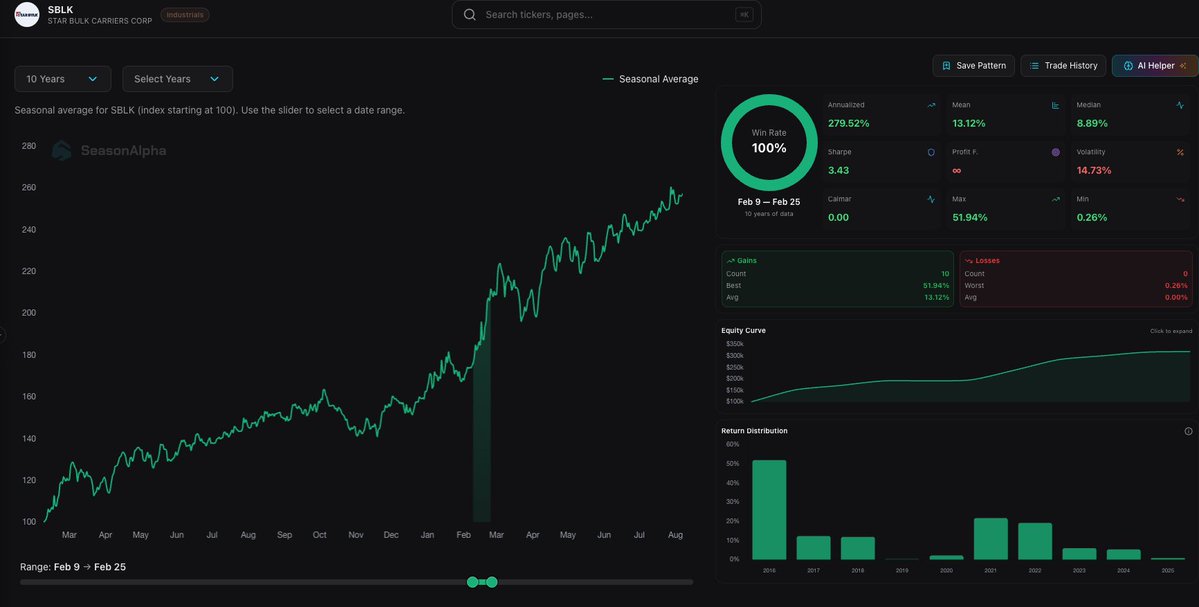
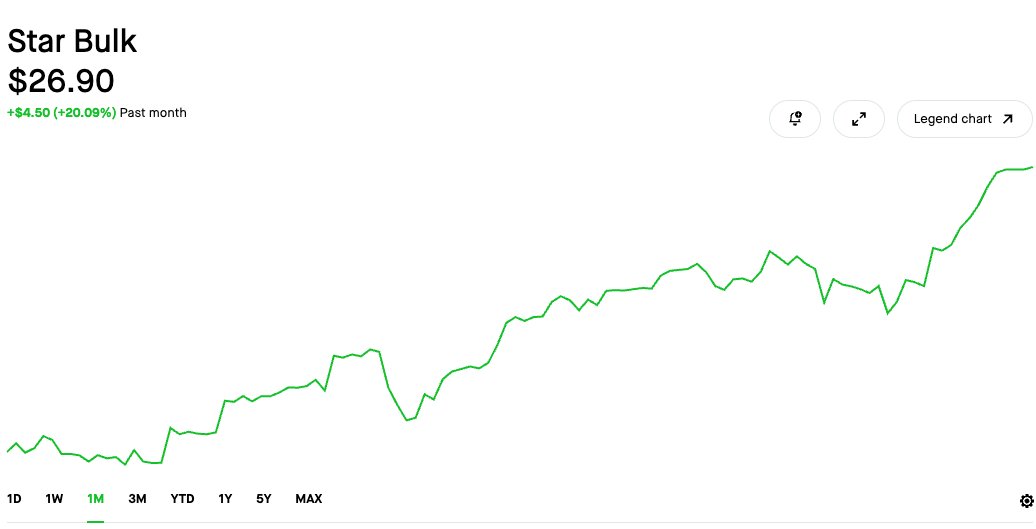
Star Bulk Carriers ( $SBLK) is a beast in February. Starting Feb 9, it enters a window that has been flawless for a decade
The 10-Year Data (Feb 9 – Feb 25):
✅ Win Rate: 100% (10/10 Green Years)
🚀 Avg Return: +13.12%
💰 Best Year: +52% Gain
📉 Losses: Zero
Shipping stocks are volatile, but in this window, the volatility is purely to the upside. The algorithm just flagged this as a "Strong Buy."