$TSLA
Reminding every single one of you of the potential macro model 1 distribution schematic that has been forming on TSLA for the past 2000 days.
SpaceX IPO is in 9 days and can act as a bullish catalyst while perfectly establishing a TEST short opportunity.
Would result into an 80% correction.
$USDT.D [macro update V2]
To remind everyone on here, this is from March 8th:
"I am here to remind you that the bottom of BTC is not in and it won't be in until USDT.D completes the full rotation towards the ATH".
BTC from a macro perspective in confluence with USDT.D has been extremely 'simple' to trade when you know what to look for because it respects our concepts to perfection.
The best first BTC spot buying opportunity, if I had to guess in advance, will be when USDT.D sweeps the ATH.
Personally I am way more interested in altcoins on spot because of the weakness they have had in the past period.
$BTC update:
My last setup was wrong, sorry - price broke through that $72k area due to US-Iran escalation news.
Bitcoin is at a key support now and the 4h50EMA is very overextended so we should get a quick recovery to $70k-$71k. That's what I'm trading at the moment.
If that recovery takes place and then price falls again, we must pay attention to this current support because if it breaks, then price will trade towards the range lows.
Still struggling to trade this BTC Price Action more than usual, but I'm sure I'll get back to my usual performance soon.
$USDT.D [update]
The highlighted model 1 accumulation schematic on USDT.D has been completed and the technical target has been hit.
From here I am expecting price to deliver a small consolidation period before the bullish continuation, which on BTC will result in a small consolidation period before the bearish continuation towards 59K.
Regarding macro pivots the USDT.D chart truly remains king.
$BTC [macro update]
I post one playbook where I am potentially looking for a local short into a scalp long for one final move up before aggressively reversing towards 59K and some people in the comments are acting like I was not expecting this HTF lower high?
I have been screaming at the top of my lungs that this retracement leg was going to result in a lower high, without EVER changing my statement, since calling the start of the retracement leg on the 11th of Feb.
My apologies for not calling the EXACT bearish reversal down to the 1m timeframe like I have done in almost all previous macro pivots, the price action this time around was more difficult due to the lack in local #TCT distribution models --> I'm human.
Imagine attacking the guy that is one of the only people in this space actually trying to help you.
bitcoin:native just tapped local demand on the daily timeframe
So... bounce or die from here !
But this is not a place to engage into shorts, it's rather a take profit from them or chase a LTF bullish reversal
let's see 👀
Interested in this long on BTC.
Price approached the VAL of the old range.
Gave a first 1H MSB, along with a clean divergence on RSI with a three-drive pattern.
Would like to enter on aggressive Fib levels, demand, and that sort of range low.
Invalidation just above structure.
Aiming at that potential range high and 1H supply.
Caveat: we just left an unswept low at 64.9, so might get another sweep lower before a bounce.
I still hold my swing short. This is just a scalp.
$BTC [market update video]
In this video I am recapping the price action in relation to my expectational orderflow that has been shared and talk about what you can expect going forward.
Yes, we will be taking out the 59K low as I have been preaching ever since the retracement leg started in Feb.
I will be a bit less active on X in the coming period and try to pack as much value in compact videos like these.
Do the work guys and watch the video, input = output.
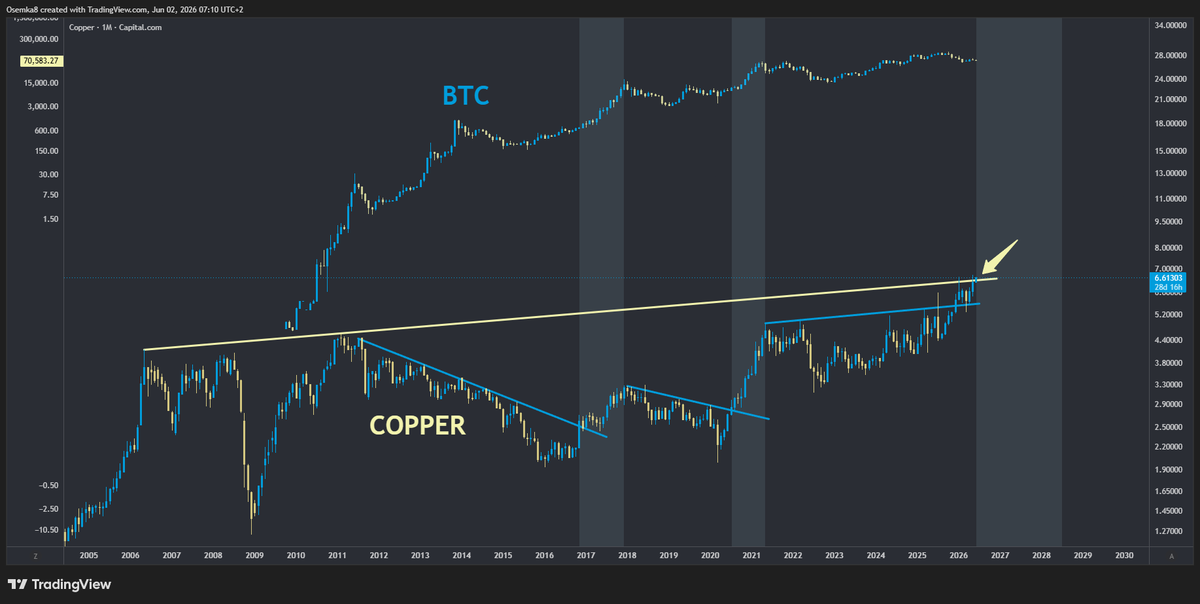
Early in the month yet $COPPER is trying to escape a 21y long trend
Recession fears are reserved for when this chart cannot escape the trend and rejects, not at a base of a parabolic move
Bitcoins weakness against the wider market has reached its highest point ever.
It is now the only macro asset not in expansion.
It was very tightly correlated to IGV for years, all the way until a few weeks ago.
Now, even IGV has played out its expanded flat correction...
While Bitcoin fails to capture the momentum.
At this moment, Bitcoin has completely decoupled from every other macro asset, for the first time since it was created.
Why is this happening?
I honestly don't know.
But very soon, if it does not respond to the wider macro forces and catch up...
We will have to accept that Bitcoin now operates in a vacuum and it will re-define how it is viewed as an investment vehicle.
Will be the first time any macro asset has created its own unique path and ignored the underlying forces that govern financial markets.
We probably have a week or two at most for this to play out, whichever way it goes.
They told me I was in disbelief for being bearish
But the difference is that I listened the charts, while others listen to what they want to hear, and not the reality.
Listen carefully my friend, charts don’t lie.
@flaviusmg89 You know what the problem is with this break-down? It won’t stop at 60k because that support / demand has already been used. So you have to look for the next support.
But if below 70k is a big range, you look for liquidity. So 20-25k.
That’s the problem. It’s like 96k retest.
$BTC
Continues to break further down, fresh lows being printed, ranges showing signs of re-distribution, structure still bearish.
Nothing to do other than holding the swing short.
Now price threatening to fully deviate in the hold range.
Original thesis still perfectly standing. No need to overcomplicate stuff.
Trade currently sitting at 2R unrealized.
If you want to trade BTC, join @breakoutprop where you can access a 100K funded account for just $330.
Use my code 8L3XL5 for an extra 2% off: https://t.co/yojP6iIsUO


![Larskooistra_'s tweet photo. $USDT.D [macro update V2]
To remind everyone on here, this is from March 8th:
"I am here to remind you that the bottom of BTC is not in and it won't be in until USDT.D completes the full rotation towards the ATH".
BTC from a macro perspective in confluence with USDT.D has been extremely 'simple' to trade when you know what to look for because it respects our concepts to perfection.
The best first BTC spot buying opportunity, if I had to guess in advance, will be when USDT.D sweeps the ATH.
Personally I am way more interested in altcoins on spot because of the weakness they have had in the past period.](https://pbs.twimg.com/media/HJ4aY_RXkAAsPMO.jpg)

![Larskooistra_'s tweet photo. $USDT.D [update]
The highlighted model 1 accumulation schematic on USDT.D has been completed and the technical target has been hit.
From here I am expecting price to deliver a small consolidation period before the bullish continuation, which on BTC will result in a small consolidation period before the bearish continuation towards 59K.
Regarding macro pivots the USDT.D chart truly remains king.](https://pbs.twimg.com/media/HJ4NeQFXwAArQhR.png)

![Larskooistra_'s tweet photo. $BTC [macro update]
I post one playbook where I am potentially looking for a local short into a scalp long for one final move up before aggressively reversing towards 59K and some people in the comments are acting like I was not expecting this HTF lower high?
I have been screaming at the top of my lungs that this retracement leg was going to result in a lower high, without EVER changing my statement, since calling the start of the retracement leg on the 11th of Feb.
My apologies for not calling the EXACT bearish reversal down to the 1m timeframe like I have done in almost all previous macro pivots, the price action this time around was more difficult due to the lack in local #TCT distribution models --> I'm human.
Imagine attacking the guy that is one of the only people in this space actually trying to help you.](https://pbs.twimg.com/media/HJ1CyTfX0AAnuol.jpg)