It's better to wait for the results of the cement stocks. Otherwise, it's a futile exercise to calculate their $EV/ton, EV/EBITDA, FCF/share or P/FCF on the past financial results.
#Cement#KSE100#PSX
Meezan is Pakistan's largest Islamic bank. Rs. 1 trillion market cap. Stock up 83% in 52 weeks. Everyone's talking about it.
But is Rs. 600 a good entry? Let's find out with math, not hype. (1)
@MeherJazibAli I listen. Now Pakistani meat demand is rising in Uzbekistan. Pakistan focus & shifting trade in central Asia through via Iran boarder. Meat sold in Uzbekistan higher than GCC.
Three return ratios every investor should track:
ROE, ROCE, and ROA.
What's the difference? When to use which?
1. ROE (Return on Equity)
Formula: PAT ÷ Shareholder's Equity × 100
What it measures: Returns generated on shareholder money
Example:
PAT: ₹100 Cr
Equity: ₹400 Cr
ROE: 25%
High ROE (>18%) = Good
But check: Is it from operations or leverage?
ROE can be inflated by:
- High debt (leverage boosts ROE)
A company with:
₹100 Cr equity + ₹900 Cr debt
May show high ROE, but it's risky (leverage-driven)
2. ROCE (Return on Capital Employed)
Formula: EBIT ÷ (Equity + Debt) × 100
What it measures: Returns on ALL capital (equity + debt)
Example:
EBIT: ₹150 Cr
Equity: ₹400 Cr
Debt: ₹600 Cr
Total Capital: ₹1,000 Cr
ROCE: 15%
Shows true operating efficiency.
High ROCE (>20%) = Quality business
Consistently high ROCE = Moat exists
3. ROA (Return on Assets)
Formula: PAT ÷ Total Assets × 100
What it measures: How efficiently assets generate profit
Example:
PAT: ₹100 Cr
Total Assets: ₹1,500 Cr
ROA: 6.7%
ROA varies widely by sector:
- Asset-light (IT, pharma): ROA 15-25%
- Asset-heavy (manufacturing, infra): ROA 5-10%
High ROE but low ROCE = Leverage-driven
Risky!
The pattern:
Healthy company:
ROE ≈ ROCE (minimal leverage impact)
Both >15-18%
Leveraged company:
ROE >> ROCE (debt boosting ROE)
Check if sustainable
Declining trend:
FY23: ROE 25%, ROCE 20%
FY24: ROE 22%, ROCE 17%
FY25: ROE 18%, ROCE 14%
Returns falling = Business quality deteriorating OR
Competition increasing OR
Scale not helping
My framework:
Step 1: Check ROCE first
(True operating efficiency)
If ROCE >20% → Quality business
If ROCE 15-20% → Decent
If ROCE <15% → Average
Step 2: Compare ROE vs ROCE
If ROE much higher → Check debt levels
If ROE ≈ ROCE → Clean business model
Step 3: Track trend
Both improving over 3-5 years = Moat strengthening
Both declining = Competitive intensity rising
Step 4: Compare vs peers
Sector average ROCE 12%, your stock at 22% = Competitive advantage
Where to find:
Annual Report → Financial Highlights table
Usually shows all three ratios with 5-year trend
If not shown, calculate:
Balance Sheet + P&L have all the numbers needed
The hierarchy:
For quality assessment: ROCE > ROE > ROA
ROCE can't be gamed easily.
ROE can be boosted by leverage.
ROA varies too much by business model.
Always start with ROCE.
Research desk → https://t.co/Ek66KEolYG
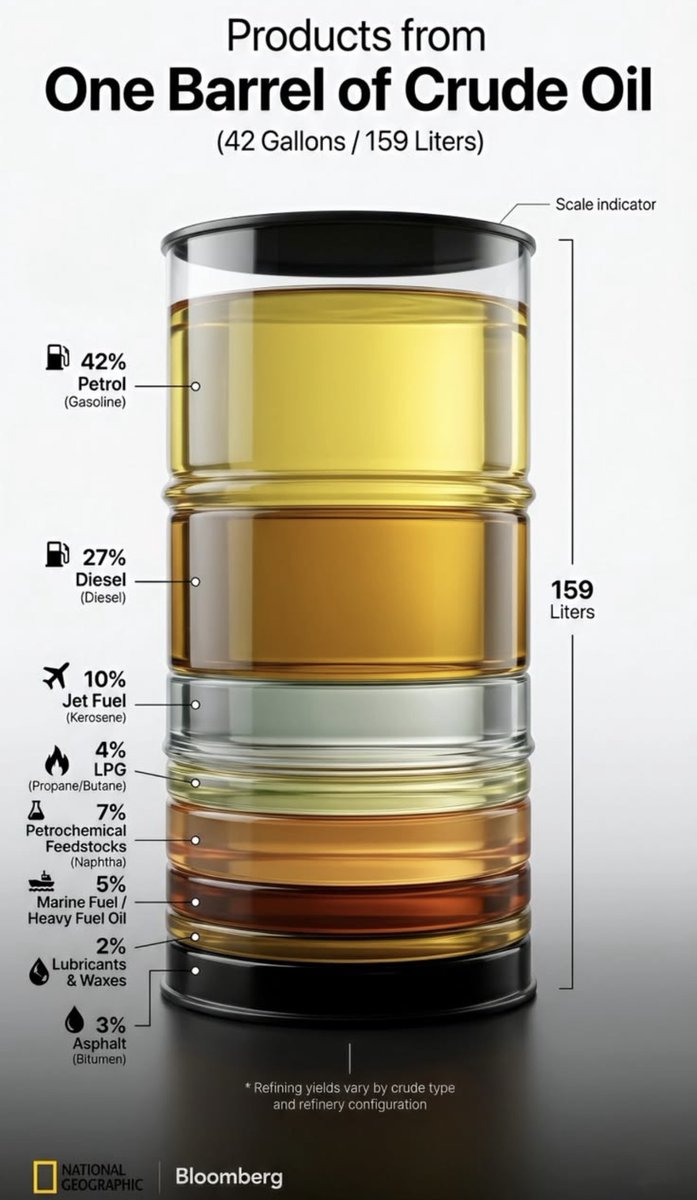
Most people think oil = petrol
🛢️But 1 barrel is so much more than that
42 gallons.
159 liters.
Here's what's actually inside:
⛽ 42% Petrol (your car)
🚛 27% Diesel
✈️ 10% Jet fuel (your flight)
🧴 7% Petrochemical feedstocks (your plastics)
🚢 5% Marine fuel (your imported goods)
🔥 4% LPG (your cooking gas)
🛣️ 3% Asphalt (your roads)
🔧 2% Lubricants & waxes
Every single product on this list is now disrupted.
Hormuz closed doesn't just mean expensive petrol.
It means expensive everything.
This is why oil isn't just a number on a screen.
It's in everything you touch.
Read my latest article to understand wht's going to happen now 🔗 Link 👇
https://t.co/fArI68xNuL
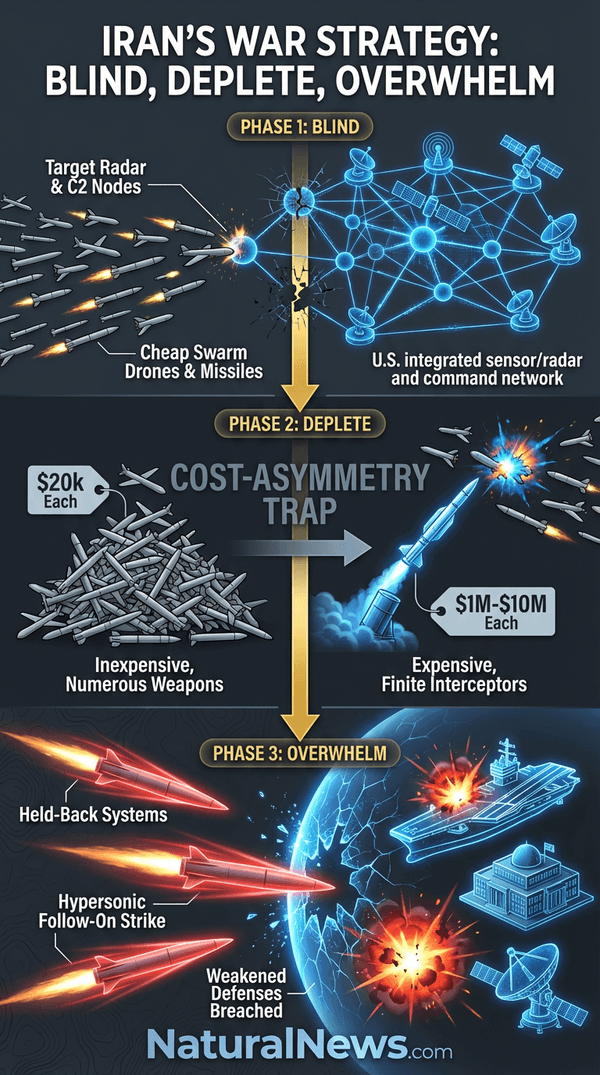
Iran's war strategy is fairly straightforward: Blind U.S. forces by taking out radar installations, then fire low-cost, low-end missiles and drones at various targets to deplete U.S. air defense interceptors.
Once U.S. air defense batteries run out of ammunition, then Iran will launch the larger, more dangerous hypersonic missiles or even ballistic missiles.
I created this infographic to explain this. Full article coming tomorrow.