Excel has reigned as the top analytics software for 37
years! 📊 Attached below are PNG files showcasing
a spectrum of formulas, from basic to advanced.
Let's dive in! #Excel#DataAnalytics
//Thread📷//
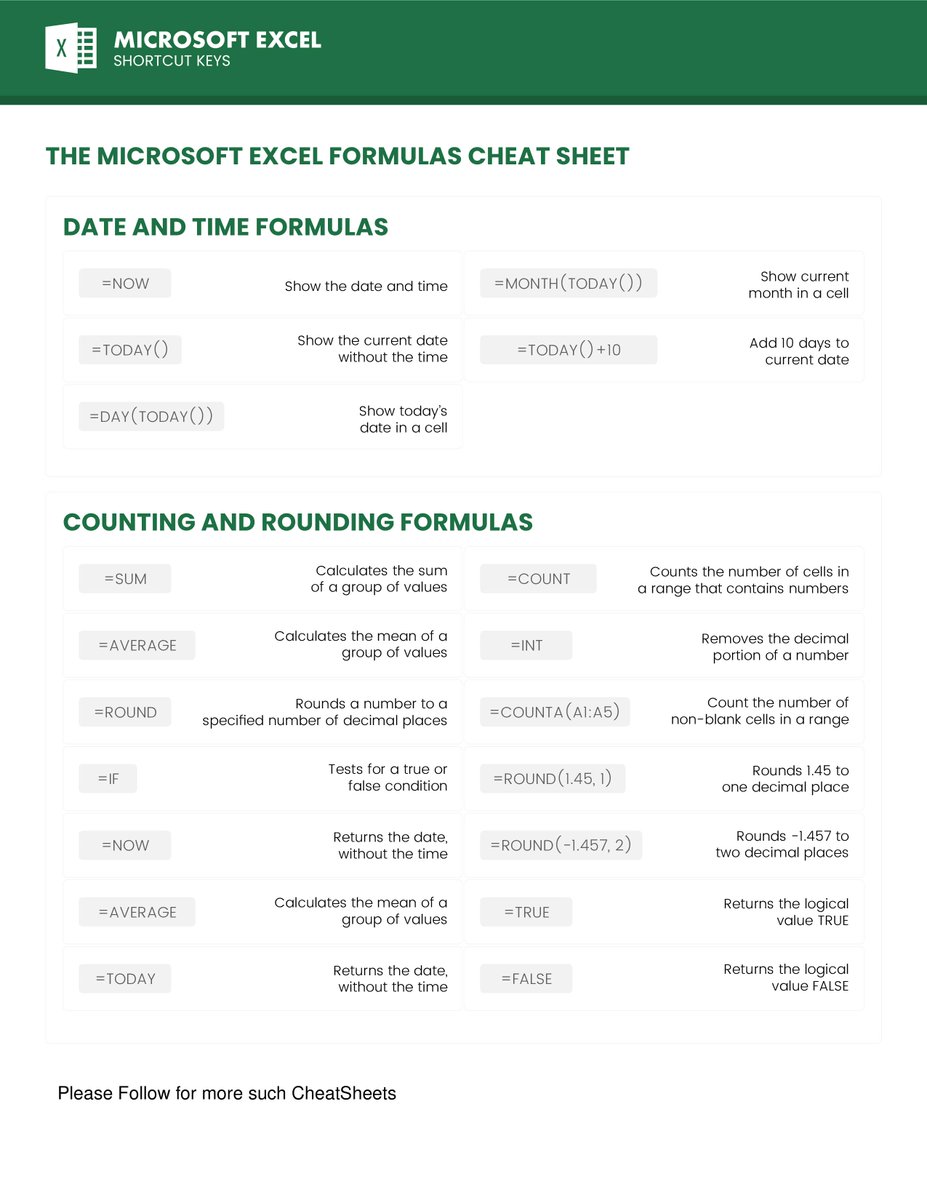
Excel Data Analytics: The ultimate guide
this thread is your ultimate guide to unleashing Excel's hidden powers for insightful data analysis. 💼📈
🔗 Link to Excel Tutorial: [https://t.co/Pj6TTqiQNS]
🔗 Link to Data Analysis Templates: [https://t.co/pQ7mB8NjiY]
//Thread👇//
6. Business Intelligence Analyst (BI Analyst):
Transforms data into actionable insights that drive business growth and improved decision-making.
Works closely with data analysts and data scientists focusing on key performance indicators and using various BI tools to visualize.
If you are interested in:
- Excel
- SQL
- Power Bi
- tableau
- Python
- Data science
Follow our account for a million and one tips and free/paid coaching programs
#excel#SQL#powerbi#tableau#python#DataScience
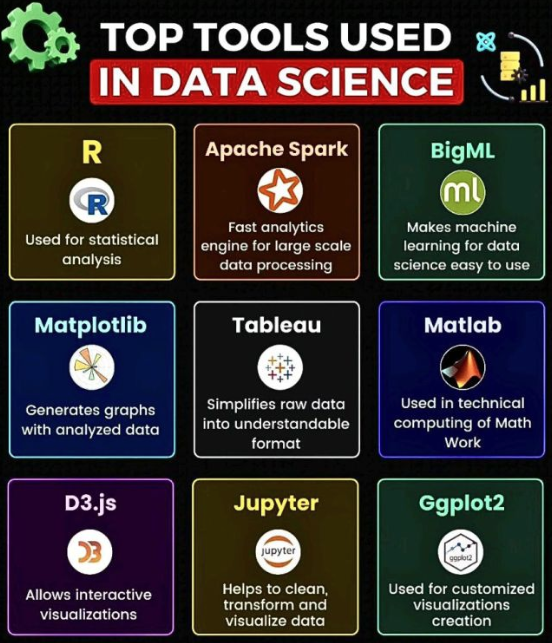
Exploring the Data Science Toolbox 📊
In the world of data science, having the right tools at your disposal can make all the difference. Here are some essential tools every aspiring data scientist should consider learning:
//Thread//👇🏿👇🏿
9. Ggplot2: A data visualization package in R that provides elegant and flexible plotting capabilities. 📊
Embrace these tools to unlock the full potential of your data science journey!


![SelfGrowthPath's tweet photo. Excel Data Analytics: The ultimate guide
this thread is your ultimate guide to unleashing Excel's hidden powers for insightful data analysis. 💼📈
🔗 Link to Excel Tutorial: [https://t.co/Pj6TTqiQNS]
🔗 Link to Data Analysis Templates: [https://t.co/pQ7mB8NjiY]
//Thread👇// https://t.co/ZaCdQMTsBU](https://pbs.twimg.com/media/F41pmqgWYAIayWT.jpg)