1h #EURUSD. There's an impulsive advance from last night's new low which is hitting resistance. This offers a buy setup if a correction appears. I have a new interpretation of the down move from September which I'll go over next time.
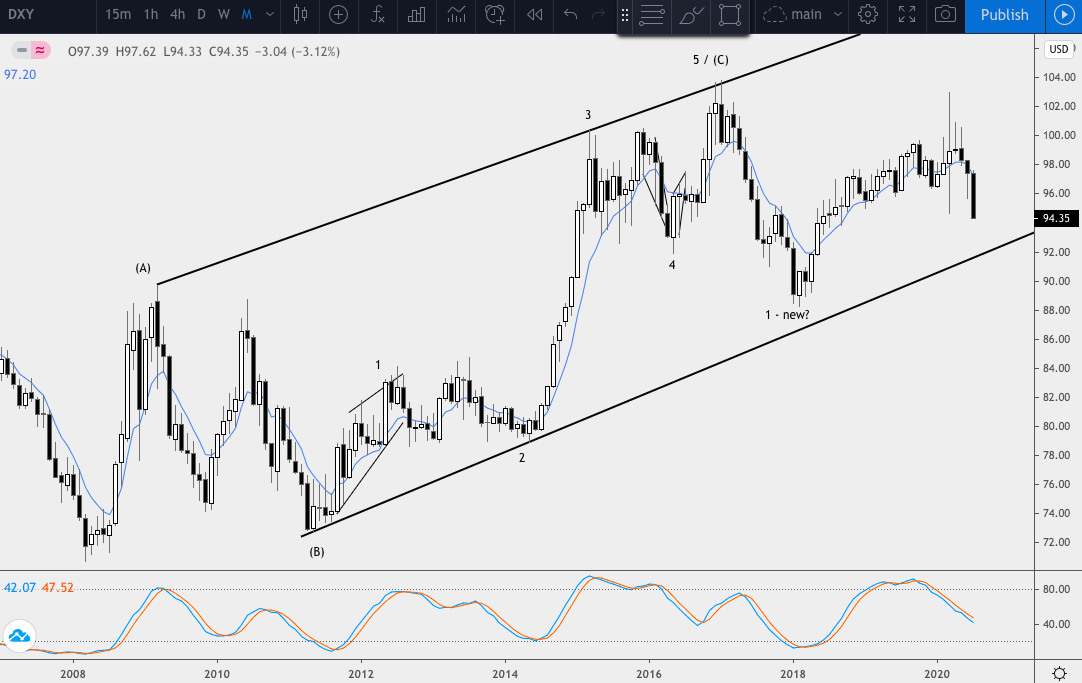
#DXY - monthly chart. Dollar Index might see a bounce as both diagonal and horizontal support are close. This chart is bearish long-term but expecting a bounce soon.
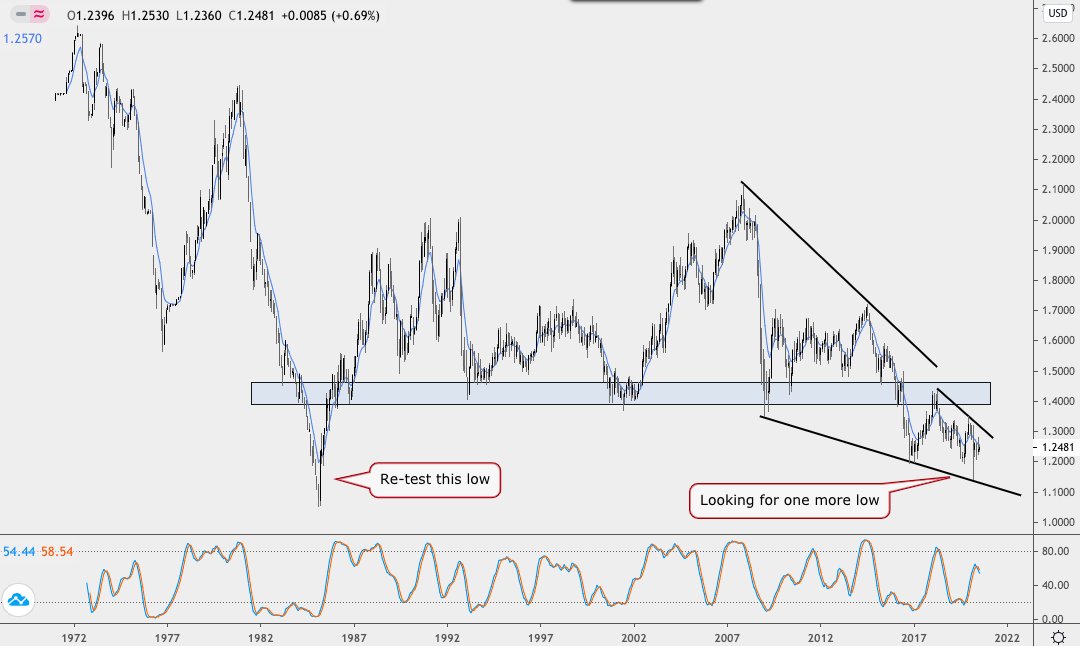
Update of the long-term #GBPUSD monthly chart. Low reached but possible to see another low within what looks like a large wedge (or wedge-within-a-wedge / WWW).
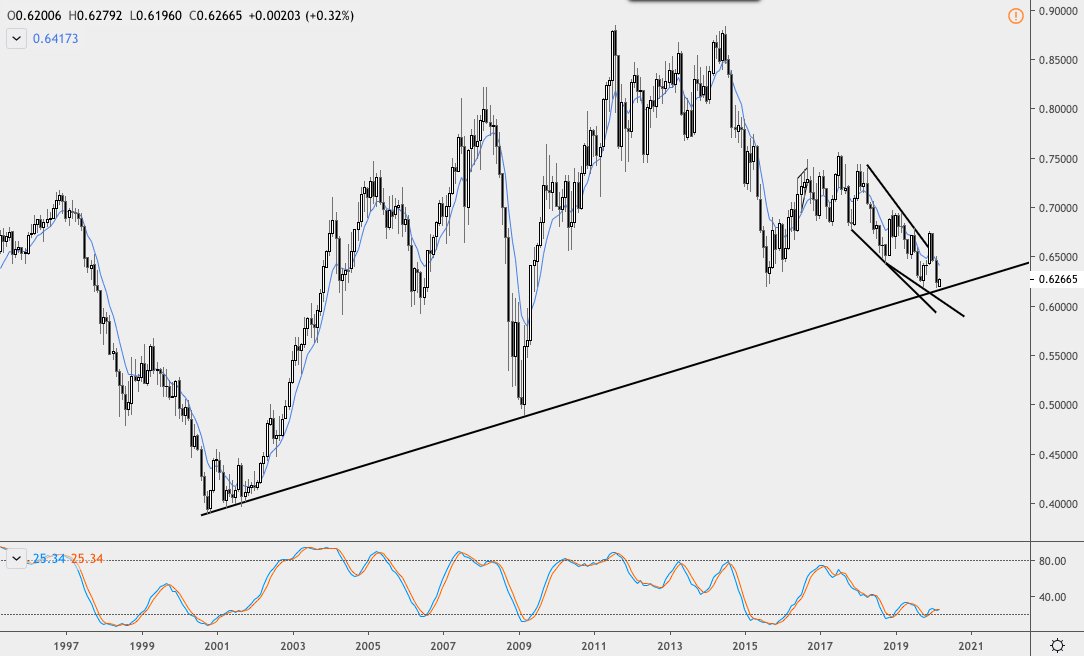
#AUDNZD - monthly chart. No change. Holding above the April 2015, 1.0020 low, sees this moving higher towards 1.15. Consecutive candle principle highlighted in the box – since then chop.
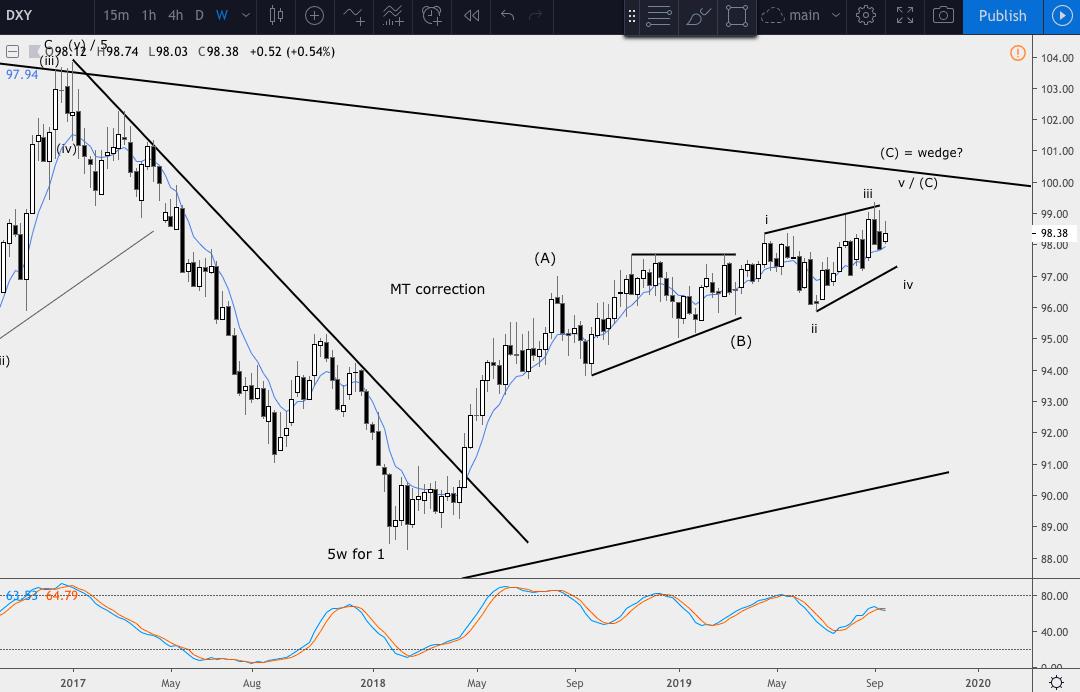
#DXY / #USDindex - weekly - So if this is wedging in wave C of a correction against 2017, then it's possible to see another low to complete iv of the wedge (holding above 97 or so) and then a new high towards 100. It appears choppy and complex against 2017.