Limited-Time: 50% Off the Full SentimenTrader Suite
Everything you need to build an evidence-based trading workflow.
Set your signals. Get alerted when it matters.
Get Full Access: https://t.co/RgqHHH4kIA
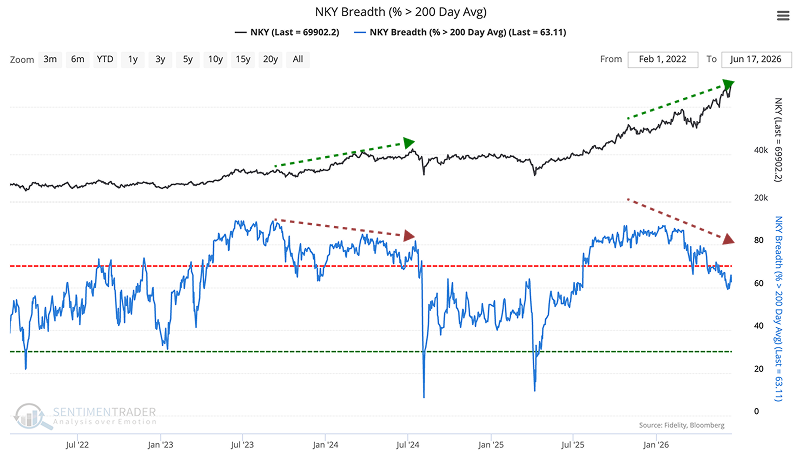
The Nikkei is making highs with fewer stocks invited.
It pushed past 71,000 while only 63% of members remain above their 200-day average. Similar setups usually resolved higher over 2 to 12 months.
The exceptions were 2007 and 2015. Drawdowns of 20% to 31%.
Get 50% off the full SentimenTrader suite: https://t.co/O3U2jacNAZ
Breadth is sending more than one message.
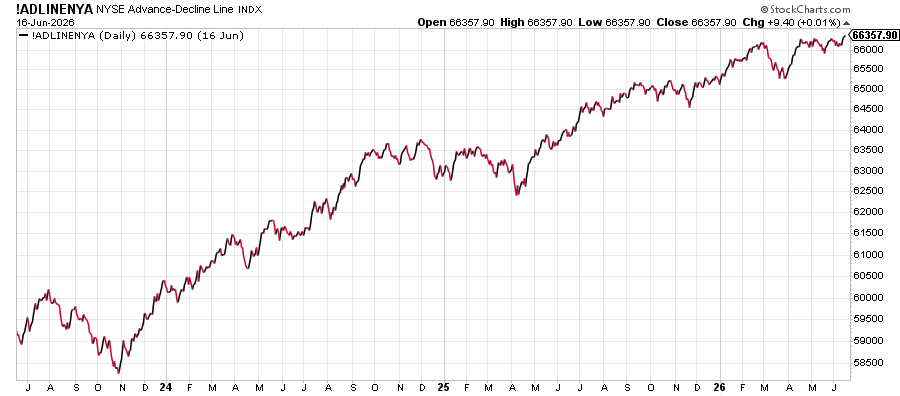
The NYSE advance/decline line just made a new high.
At the same time, Nasdaq’s 10-day Hi/Lo Logic Index crossed above 2.5. That level has historically preceded weaker near- to medium-term NDX returns.
The NYSE advance/decline line hit an all-time high yesterday. This is one of the broadest baskets of stocks out there and history tells us that breadth leads price.
Most major tops see breadth peak well ahead of price. Yet another clue this bull is alive and well.
Multi-Index Trading Model history has been less binary than the signal looks.
Across its record, the model posted a 62.9% win rate.
Current posture: long SPY, not cash.
Get 50% off the full SentimenTrader suite: https://t.co/RgqHHH3MT2
Coffee futures got their bounce.
Up more than 13% in 5 days and back to a one month high after recently closing at a 252-day low.
The last 11 similar setups all lost ground over the next 2 to 6 months.
Get 50% off the full SentimenTrader suite: https://t.co/RgqHHH4kIA
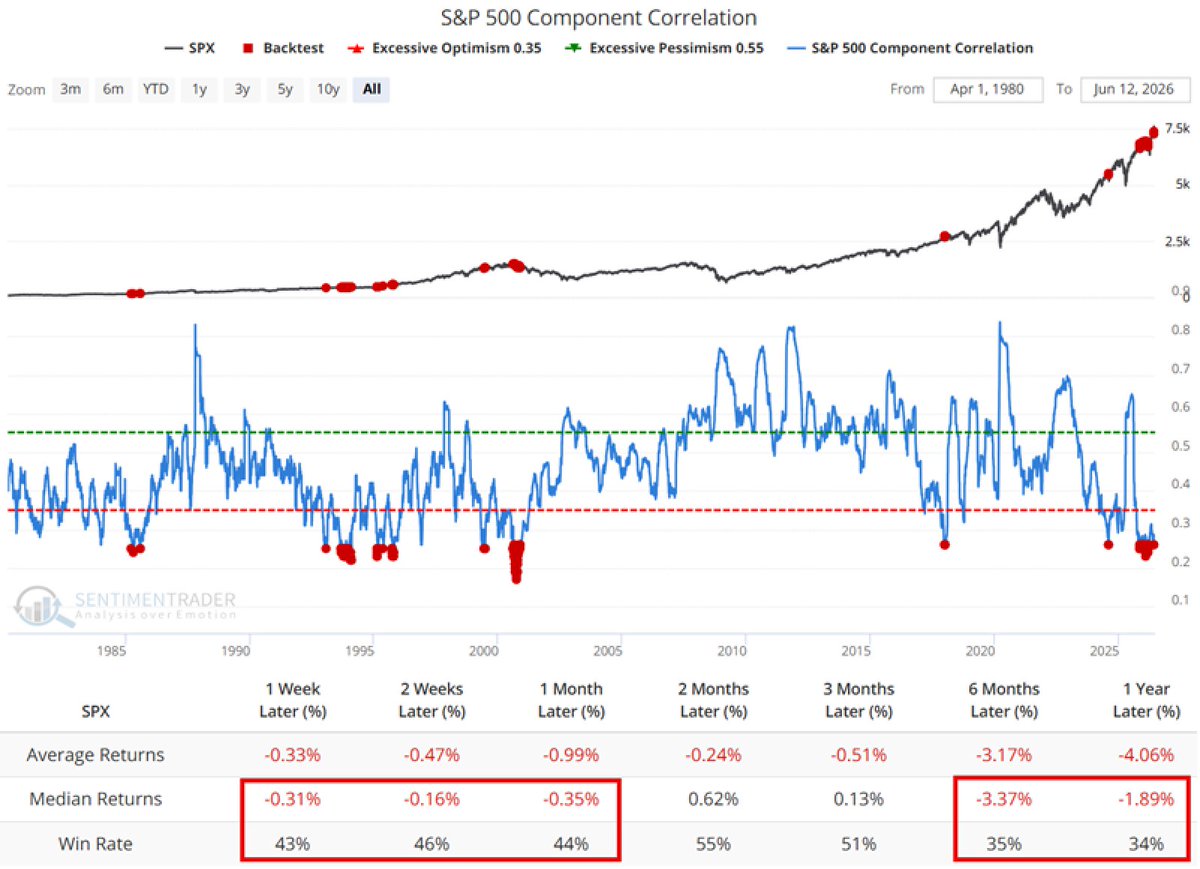
The calm got a little too calm.
When S&P 500 stocks moved this independently before, the index was higher 6 months later only 35% of the time.
Median 6-month return was a loss of 3.37%. One year later, the win rate was 34%.
Get 50% off the full SentimenTrader suite: https://t.co/O3U2jacNAZ
Crude fell 10.31% in 5 days while TLT rose 1.30%.
Since 2008, similar spreads left the S&P 500 higher 85% of the time a year later, with a median gain of 17.04%.
This has typically coincided with a fast easing in inflation pressure and looser financial conditions.
Brent is down to $80, which is the lowest level since the very early days of the war. The narrative in markets is already shifting back to "supply glut." We were at $70 before all this started, so the risk premium is rapidly being eroded. Don't chase this.
https://t.co/OlsRFkLwKS
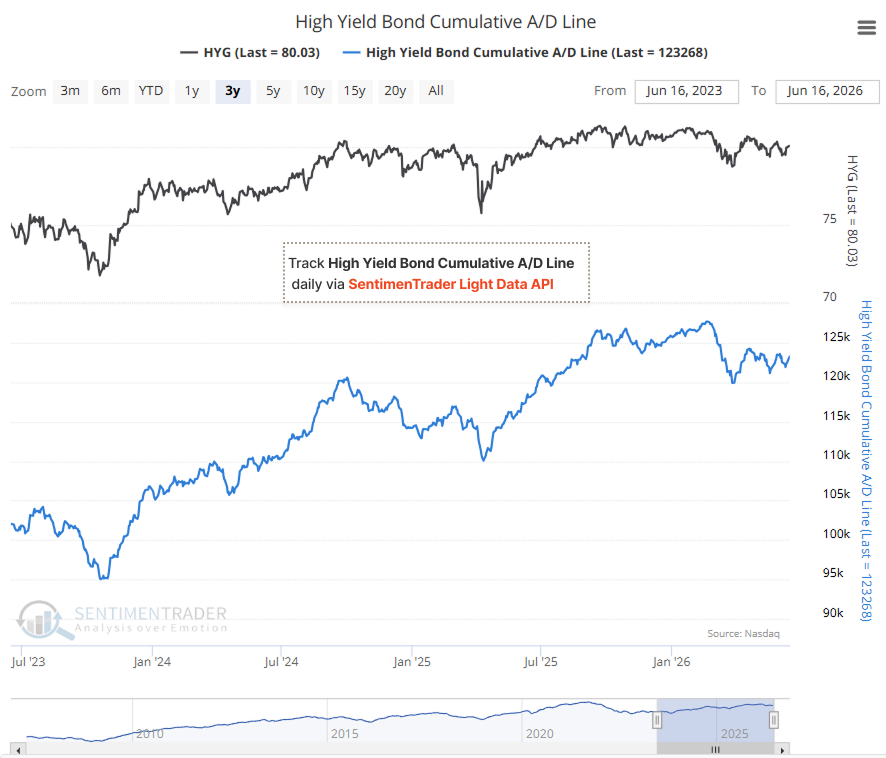
HYG is holding near 80, but high-yield breadth has not made a fresh high since early 2026.
Not a credit alarm yet. But if price stays firm while breadth rolls over again, macro risk is rising.High Yield Bond Cumulative A/D Line: 123,268 as of June 16.
Track these signals daily and integrate them into your systematic workflow via SentimenTrader Light Data API: https://t.co/xxRX5UzgB1
Crude got smoked while long bonds caught a bid.
TLT rose 1.30% over 5 days as USO fell 10.31%, sending the spread to 11.61%. After prior readings above 11.6%, the S&P 500 was higher 85% of the time 12 months later. Median gain was over 17%.
Energy and Financials were not where the fun was.
Get 50% off the full SentimenTrader suite: https://t.co/O3U2jacNAZ
The market got a lot less broken.
When fewer than 10% of industry groups were still more than 20% below their 52 week highs, the S&P 500 was higher 93% of the time a year later. Median return was 21.69%.
Get 50% off the full SentimenTrader suite: https://t.co/RgqHHH3MT2
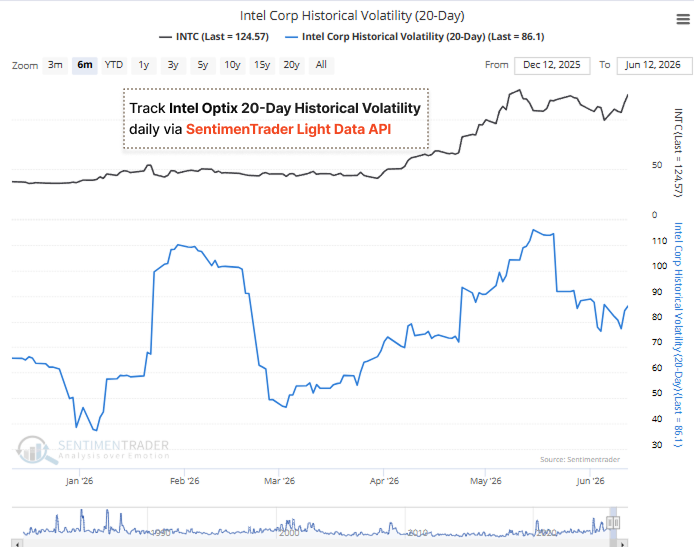
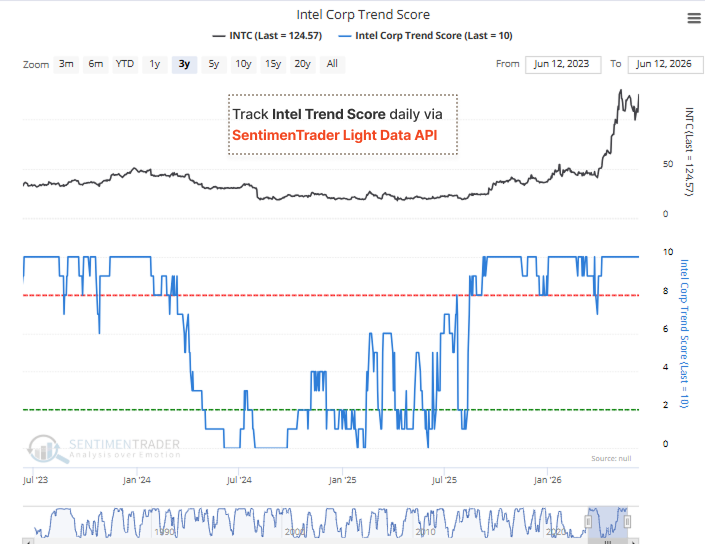
$INTC regime shift in progress
Trend Score: 10 (max)
Optix: 92.61 (extreme optimism)
20D vol: 86.1 (elevated)
Trend + sentiment aligned.
Momentum is still running, but positioning is getting stretched.
Available through SentimenTrader Light Data API: https://t.co/0yVDj0E0M4
Two long-term stock models are both flashing long $SPY right now.
The Multi-Index Trading Model and its fundamentals-based version have historically compounded at nearly 15% annually when blended equally.
The edge comes from sitting out structural bear markets like 2008, drastically cutting drawdowns while staying invested during uptrends.
Both are available in the Strategies on SentimenTrader: https://t.co/lNxlZfm9HM
Payroll beats above 87k have a gold aftershock.
Gold was positive 79% of the time six months later after similar beats.
Bonds took the release-day hit. Gold showed up later.
A limited-time offer is coming soon. Stay tuned: https://t.co/iJUI9CJyKS
Gold was part of the liquidation.
The metal is now down 24% from its high. Since 1980, similar drawdowns showed a 70% one-month win rate, but only 30% were higher a year later.
Relief was not repair.
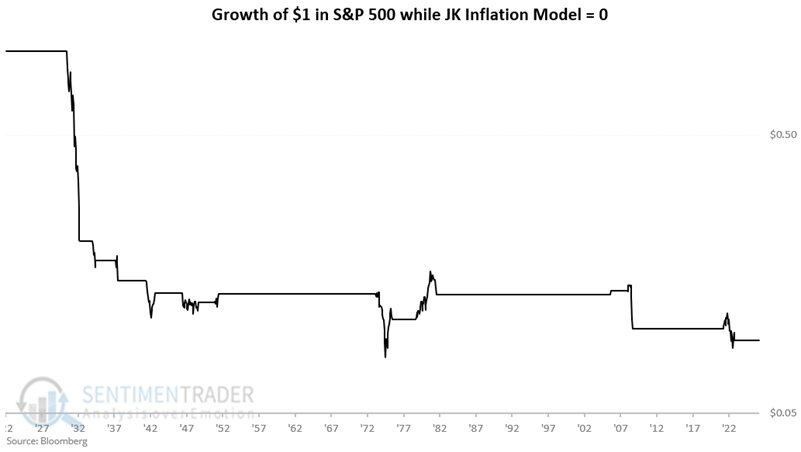
Both wholesale and consumer inflation just moved outside their normal ranges.
Since 1922, the S&P 500 rose only 36% of the time during these periods.
A dollar invested only during these periods since 1922 lost 90.8%.
Read full analysis: https://t.co/smXR4bRXzM