Just a reminder that the article provides performance metrics only in the training dataset, with some "cellular aging clocks" showing there correlations with chronological age of r<0.3 https://t.co/adTVaD95LQ
Looking forward to presenting scDataset at #ICML2026 in Seoul next week! 🇰🇷
It's a fast, drop-in PyTorch data loader for training on single-cell datasets too large to fit in memory, giving you the speed of streaming from disk with the sampling quality of full random shuffling. 🧵
The biological age of individual cell types can be evaluated using plasma proteomics, revealing diverse aging profiles across more than 40 cell types and links between the accelerated aging of specific cell types and disease.
https://t.co/cYxEDin5kc
Now online! Multiscale integration of tissue and chromatin context converts cell heterogeneity into stable intestinal patterning https://t.co/whnGVXgcWM
Genome length strongly correlates with cell size; even more than cell complexity, number of protein-coding genes, etc. This was extremely surprising to me.
Initially, I expected that genome size would correlate with protein-coding genes. Although there is a linear relationship in prokaryotes (which have compact genomes with fewer regulatory elements), there is a logarithmic relationship in eukaryotes. A eukaryote called Edhazardia aedis, for example, has a genome with ~51 million nucleotides that only encodes 4,200 proteins. Some bacteria have genomes that are about an order-of-magnitude smaller in length, yet encode more proteins than this!
And what of cell complexity? Surprisingly, there is no relationship between genome length and complexity. Eukaryote genomes range in size by 200,000-fold. There are amoebas, salamanders, and small plants with genomes much larger than our own. An onion’s genome is five times larger than a human’s.
The closest correlation — and one that scales across kingdoms of life — is between genome length and cell size. Many papers on this subject have been written by T. Ryan Gregory, a Canadian biologist, who has collected thousands of examples of genome sizes and cell sizes. Gregory also maintains a database on genome sizes across the tree of life, at genomesize[dot]com.
In a 2007 paper, Gregory plotted this relationship for red blood cells taken from various organisms, such as fishes, amphibians, reptiles, and birds. (Red blood cells were selected so that each “type” of cell would be standardized across the organisms.) See chart #1 below.
Many recent papers continue to show the same relationship. I downloaded raw data from a 2023 paper, for example, that lists genome sizes and cell volumes for thousands of bacteria and eukaryotes. 53 organisms in this dataset have both a recorded cell volume *and* genome size, and those points are plotted in the second chart below.
The question is why this relationship exists at all. What does genome size have to do with cell size?
Many biologists argue for some kind of physical scaling. The size of a cell’s nucleus corresponds closely with its overall size, and most cells keep their “nuclear-to-cytoplasmic volume ratio” at a constant level. The more DNA a cell has, then, the more space it occupies, and the larger its nucleus (and overall cell size) must be to maintain this ratio.
This explanation is unsatisfying. For one, bacteria don’t have a nucleus, so why does this scaling apply to them? And second, the genome typically occupies less than 1% of the total nucleus volume, so why would a larger genome lead to a bigger nucleus mechanistically? There is plenty of space in there!
(Sidebar: A tiny fern from a South Pacific island has the world’s largest genome: 160.45 billion bases, more than 50-times larger than a human genome. If stretched out, this genome would be longer than the Statue of Liberty is tall; and yet, it occupies only a small portion of the fern’s nucleus.)
The reality seems to be that biologists don’t really understand (to a satisfying degree) why this relationship is true. Simple questions in biology often yield exceptionally complex answers.
Atherosclerosis remains the leading cause of death worldwide, but we lack circulating biomarkers for systemic atherosclerosis burden.
Our work describing the development of Olink-based proteomic signatures of atherosclerosis is now out in Cardiovascular Research.
Gaining biological insights through supervised data visualization
If you have ever run t-SNE or UMAP on a biological dataset and gotten a beautiful plot that had nothing to do with the question you cared about, you have met the core problem this paper tackles.
Unsupervised embeddings preserve whatever variation dominates the data, which is often not the variation tied to your labels. The existing supervised fixes tend to overcorrect: they bake class membership into the distance metric and force artificially clean separation, which looks impressive but misleads you about the real structure. They also break on continuous labels and cannot place new unlabeled points.
Jake Rhodes and coauthors propose RF-PHATE, which threads the needle. Instead of distorting distances by class, they train a random forest on the labels and extract RF-GAP proximities, similarities defined by how often points land in the same terminal nodes, weighted to reproduce the forest's out-of-bag predictions. These proximities already encode feature importance for the supervised task.
They then feed them into a PHATE-style diffusion pipeline: row-normalize into a Markov operator, add a PageRank-like damping term so isolated clusters do not trap the random walk, power the operator for global structure, and map the potential distances to low dimensions with MDS. The result emphasizes label-relevant geometry while suppressing noise, and because random forests handle mixed and continuous targets natively, it works for classification and regression.
What makes the paper convincing is the stress-testing. On synthetic data with 500 added noise variables, RF-PHATE recovers the true branching structure while unsupervised methods collapse and class-conditional methods shatter it into fake clusters. They also introduce three metrics that penalize hyperseparation, then show across 27 datasets that RF-PHATE preserves structure without inflating separation, unlike supervised UMAP and S-tSNE. In multiple sclerosis data it surfaces a nonbenign RRMS subgroup, and on RNA-seq it holds cell-type separation even at 75 percent dropout where PHATE and UMAP fail.
The useful idea is that supervision can steer a visualization toward the variable you actually care about without manufacturing the separation you are trying to detect, the trap that makes most supervised embeddings useless for decision support. In drug discovery, clinical biomarker work, or materials screening, where you have noisy high-dimensional data plus a relevant label, this lets you explore structure that respects your target while staying honest about overlap.
Paper: Rhodes et al., Nature Computational Science (2026) , journal license | https://t.co/x1rrNJxnet
Happy to share our new work: "scEPS integrates genetic and single-cell disease atlas data to provide granular mechanistic insights into complex human diseases"! 🧬🔬
https://t.co/kcqGxkWDGA
It took several years, but @hmbaghdassarian got it working... genome scale models of human metabolism, transcription, translation, and protein secretion (ME+secretion model). Check out the preprint!
https://t.co/WUdZ49IsNs
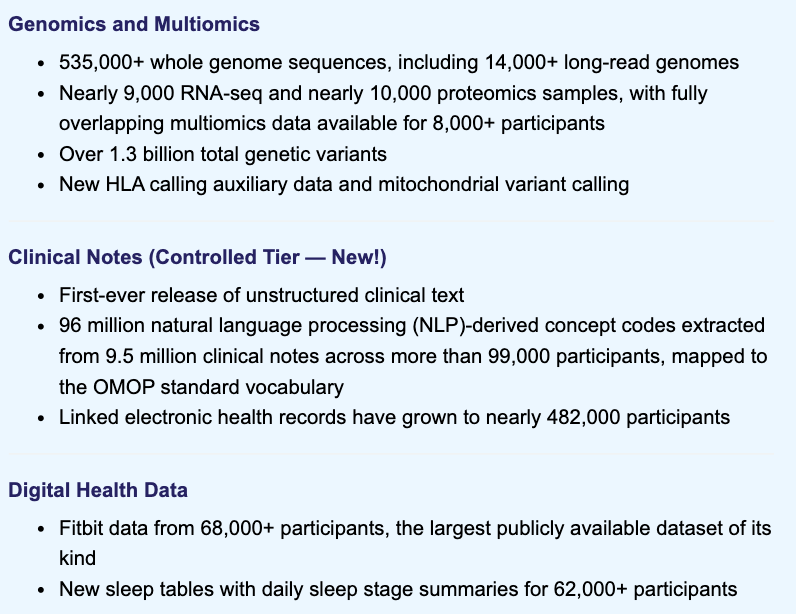
NIH @AllofUsResearch has just released a massive multi-omics dataset, including:
• 535K WGS (120K+ added; now larger than UKB)
• ~10K proteomics + RNAseq + long-read
• ML-curated clinical notes
• 68K with Fitbit data
Kudos to this great initiative and to the participants for advancing science
https://t.co/Z7MnU7432S
In the latest issue! D-SPIN constructs regulatory network models from scRNA-seq that reveal organizing principles of perturbation response https://t.co/ibtoGvkSEP


![NikoMcCarty's tweet photo. Genome length strongly correlates with cell size; even more than cell complexity, number of protein-coding genes, etc. This was extremely surprising to me.
Initially, I expected that genome size would correlate with protein-coding genes. Although there is a linear relationship in prokaryotes (which have compact genomes with fewer regulatory elements), there is a logarithmic relationship in eukaryotes. A eukaryote called Edhazardia aedis, for example, has a genome with ~51 million nucleotides that only encodes 4,200 proteins. Some bacteria have genomes that are about an order-of-magnitude smaller in length, yet encode more proteins than this!
And what of cell complexity? Surprisingly, there is no relationship between genome length and complexity. Eukaryote genomes range in size by 200,000-fold. There are amoebas, salamanders, and small plants with genomes much larger than our own. An onion’s genome is five times larger than a human’s.
The closest correlation — and one that scales across kingdoms of life — is between genome length and cell size. Many papers on this subject have been written by T. Ryan Gregory, a Canadian biologist, who has collected thousands of examples of genome sizes and cell sizes. Gregory also maintains a database on genome sizes across the tree of life, at genomesize[dot]com.
In a 2007 paper, Gregory plotted this relationship for red blood cells taken from various organisms, such as fishes, amphibians, reptiles, and birds. (Red blood cells were selected so that each “type” of cell would be standardized across the organisms.) See chart #1 below.
Many recent papers continue to show the same relationship. I downloaded raw data from a 2023 paper, for example, that lists genome sizes and cell volumes for thousands of bacteria and eukaryotes. 53 organisms in this dataset have both a recorded cell volume *and* genome size, and those points are plotted in the second chart below.
The question is why this relationship exists at all. What does genome size have to do with cell size?
Many biologists argue for some kind of physical scaling. The size of a cell’s nucleus corresponds closely with its overall size, and most cells keep their “nuclear-to-cytoplasmic volume ratio” at a constant level. The more DNA a cell has, then, the more space it occupies, and the larger its nucleus (and overall cell size) must be to maintain this ratio.
This explanation is unsatisfying. For one, bacteria don’t have a nucleus, so why does this scaling apply to them? And second, the genome typically occupies less than 1% of the total nucleus volume, so why would a larger genome lead to a bigger nucleus mechanistically? There is plenty of space in there!
(Sidebar: A tiny fern from a South Pacific island has the world’s largest genome: 160.45 billion bases, more than 50-times larger than a human genome. If stretched out, this genome would be longer than the Statue of Liberty is tall; and yet, it occupies only a small portion of the fern’s nucleus.)
The reality seems to be that biologists don’t really understand (to a satisfying degree) why this relationship is true. Simple questions in biology often yield exceptionally complex answers.](https://pbs.twimg.com/media/HL6SHzpaoAE9U1y.jpg)


![NikoMcCarty's tweet photo. Genome length strongly correlates with cell size; even more than cell complexity, number of protein-coding genes, etc. This was extremely surprising to me.
Initially, I expected that genome size would correlate with protein-coding genes. Although there is a linear relationship in prokaryotes (which have compact genomes with fewer regulatory elements), there is a logarithmic relationship in eukaryotes. A eukaryote called Edhazardia aedis, for example, has a genome with ~51 million nucleotides that only encodes 4,200 proteins. Some bacteria have genomes that are about an order-of-magnitude smaller in length, yet encode more proteins than this!
And what of cell complexity? Surprisingly, there is no relationship between genome length and complexity. Eukaryote genomes range in size by 200,000-fold. There are amoebas, salamanders, and small plants with genomes much larger than our own. An onion’s genome is five times larger than a human’s.
The closest correlation — and one that scales across kingdoms of life — is between genome length and cell size. Many papers on this subject have been written by T. Ryan Gregory, a Canadian biologist, who has collected thousands of examples of genome sizes and cell sizes. Gregory also maintains a database on genome sizes across the tree of life, at genomesize[dot]com.
In a 2007 paper, Gregory plotted this relationship for red blood cells taken from various organisms, such as fishes, amphibians, reptiles, and birds. (Red blood cells were selected so that each “type” of cell would be standardized across the organisms.) See chart #1 below.
Many recent papers continue to show the same relationship. I downloaded raw data from a 2023 paper, for example, that lists genome sizes and cell volumes for thousands of bacteria and eukaryotes. 53 organisms in this dataset have both a recorded cell volume *and* genome size, and those points are plotted in the second chart below.
The question is why this relationship exists at all. What does genome size have to do with cell size?
Many biologists argue for some kind of physical scaling. The size of a cell’s nucleus corresponds closely with its overall size, and most cells keep their “nuclear-to-cytoplasmic volume ratio” at a constant level. The more DNA a cell has, then, the more space it occupies, and the larger its nucleus (and overall cell size) must be to maintain this ratio.
This explanation is unsatisfying. For one, bacteria don’t have a nucleus, so why does this scaling apply to them? And second, the genome typically occupies less than 1% of the total nucleus volume, so why would a larger genome lead to a bigger nucleus mechanistically? There is plenty of space in there!
(Sidebar: A tiny fern from a South Pacific island has the world’s largest genome: 160.45 billion bases, more than 50-times larger than a human genome. If stretched out, this genome would be longer than the Statue of Liberty is tall; and yet, it occupies only a small portion of the fern’s nucleus.)
The reality seems to be that biologists don’t really understand (to a satisfying degree) why this relationship is true. Simple questions in biology often yield exceptionally complex answers.](https://pbs.twimg.com/media/HL6SH_SaMAAOkmy.png)