@MFHoz q is a mean reverting metric. Bear market bottoms end with tobin’s q around 0.3, CAPE below 10. USA has an overvalued equity market and q = 1.41, CAPE 30, SP 500 @ 4057. If we drop to historical means q level = 0.75, CAPE = 17.3 that would leave SP 500 around 50% lower than now.
🚨The US stock market is more overvalued today than at any point in the last 125 years:
Tobin's Q Ratio hit 2.11, the highest reading since records began in 1900 and +149% above its long-term average of 0.85, according to Advisor Perspectives analysis.
The Q Ratio measures the total market value of all US corporations relative to the replacement cost of their physical assets.
A ratio above 1.0 suggests the market is pricing companies above what it would cost to rebuild them from scratch.
At 2.11, investors are paying more than twice what these companies would cost to replace, the highest level on record.
However, this is not a short-term timing indicator, and high readings can persist for extended periods, particularly where intangible assets, software, brand value, and earnings power are poorly captured by replacement cost measures.
Historically, extreme Q Ratio readings have tended to align with late-stage bull market conditions, including prior major peaks, but the signal is more structural than tactical.
The market is not just expensive, it is priced for perfection.
@biancoresearch If no deal the stock market may still go up as the market doesn’t have any rationality regarding valuations, not at these levels, the business cycle seems to have gone out of existence
@adamtaggart@LawrenceLepard The return of persistent inflation after 40 years absence is the problem for the fed who will have problems dealing with this and could lead to the ultimate secular bear market low
@hussmanjp Looking at the graph the next recession seems nearer than thought. As Jeremy Grantham says higher the valuations the lower the future return, not a timing tool.
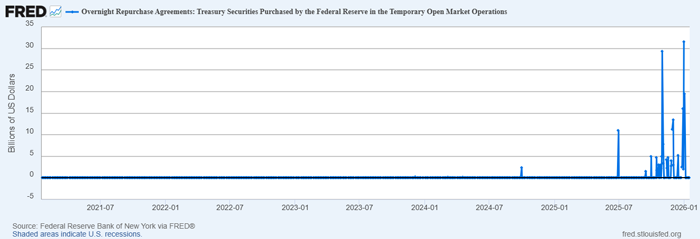
We have reported that margin debt at brokerage firms and the ratio of margin debt to cash reserves in brokerage accounts are both at all-time highs.
Borrowing money via repurchase-agreements (repos) to gamble in financial markets has been increasing rapidly, too. As you can see in the chart, repo activity through the Fed was negligible through mid-September 2025, but in the past four months, it has soared.
⚠️US growth stocks have NEVER been this expensive:
The cyclically-adjusted P/E ratio for the US MSCI Growth Index hit a RECORD ~74x.
This measures how much investors are paying per Dollar of average earnings over the last 10 years, adjusted for inflation.
This is WELL ABOVE the 2000 Dot-Com Bubble peak of ~70x.
The LT average from 1985 to 2015 was ~30x, meaning current valuations are 2.5 TIMES the norm.
This is UNCHARTED territory, and history suggests such valuations do not end well.
⚠️The US yield curve is rapidly STEEPENING:
The difference between 10-year and 2-year Treasury yields has sharply risen over the last 2.5 years.
The yield curve has now been positive for 14 months, reaching its highest in 4 years.
In the past, once the yield curve turned sharply positive, the US economy was already in a recession.
This time, a combination of interest-rate cuts tied to a recessionary job market and concerns over soaring US public debt and large deficits is driving the move.
Don't miss the latest Merryn Talks Money podcast (and video!) - @MerrynSW interviews GMO's Jeremy Grantham on AI ("obviously a bubble") and his memoir, "The Making of a Permabear". Podcast link here: https://t.co/5USLbBouEg Video here - https://t.co/UQyqVLD3Hq
The US stock market has never been this expensive:
Currently, a record ~33% of S&P 500 stocks are trading at Price-to-Sales ratios above 10x on a market-cap weighted basis.
This exceeds the 2000 Dot-Com Bubble peak of 30%. 👇
https://t.co/1kYDOLZubH