Bitcoin just hit one of my favorite momentum signals.
Daily RSI closed above 85.
I’ve studied every one of these sequences I could find in Bitcoin’s history.
The initial 85+ close has never marked the immediate intermediate top.
Every sequence I catalogued went on to:
print at least 3 drives above 85
produce at least a mini-parabolic run
Most traders see RSI at 85 and think “overbought.”
Bitcoin has historically treated that first extreme reading a lot more like momentum than exhaustion.
And I’ve always wondered how much Bitcoin’s scarcity contributes to that behavior. When demand suddenly accelerates, higher prices don’t create more Bitcoin. Price has to keep searching for somebody willing to sell.
None of this means straight up.
It means I’m not going to fight extreme strength just because an oscillator says Bitcoin is “too strong.”
I posted this phenomenon in 2019. Again in 2020. Again in 2023. All produced amazing results.
And here we are again.
History doesn’t owe us another repeat.
But until price proves otherwise, I’m treating this as momentum worth respecting.
This is an update on $BTC I just did for my private community. I've decided to post it here for all those that wished me well on my last post despite me being absent from YouTube in order to focus on other goals that are important to me.
We all have goals in life and when I have mine, I hyper focus. Unapologetically me.
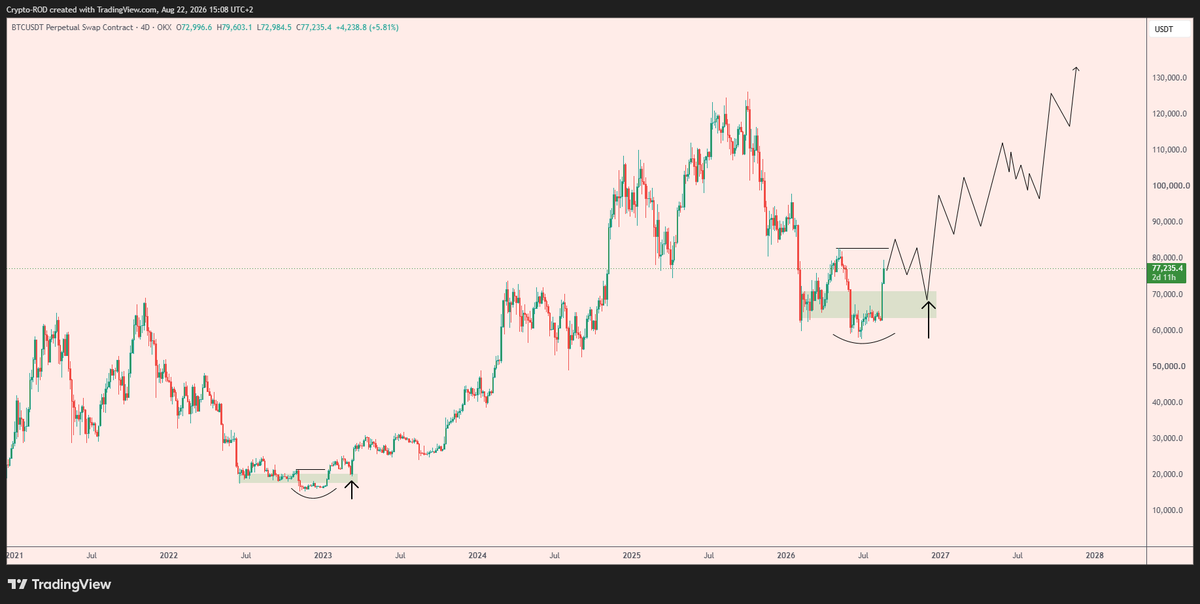
One thing I forgot to say in this video is that if the last scenario I talked about does play out, the target could end up being around 69-71k which may give a macro HL and confirm last weeks move anyway.
But watch the whole video because that's not all that's important right now.
I hope you understand that this cycle hasn’t seen its top yet. I hope you understand that this cycle won’t top until miners’ revenue power turns positive again, and I hope you understand what that means for the future.
I laid out a $BTC bullish scenario because the weekly candle will print a buy signal.
This time would be different:
- This would be the shortest bear market ever
- Bitcoin has always retested the average buy price which is still downward sloping at $51,926
- Potential profit has always gone negative, still positive
Bear case:
IF price stalls out at the $82,000 area and does not make a higher high and starts to breakdown from upward trend line, THEN it's possible this bear market becomes an extended vs. shortened.
For this scenario to happen, I think the stock market would have to go into a -30% correction. Green oval shows that we could see extended bullish divergence similar to the extended bearish divergence in the last bull run.
This signal has a near-perfect success rate for Bitcoin...
In the context of a bear market, once price is able to break above the 55-week EMA and secure a weekly close above it, a new bull market has started every time.
Perhaps the only asterisk is for the 2019 breakout.
But, Bitcoin still gained +150% in 2 months after that breakout.
Right now, Bitcoin is retesting that same 55-week EMA.
Break above it, and the odds significantly increase to suggest that the bear market is officially over.
$BTC
The level you want to all in.
Same setup that played out in 2022. Once the reversal triggers, this green zone is the one to load with confidence
A sharp long flush into it before continuing up would be the perfect confirmation
History doesn't repeat, it rhymes✍️
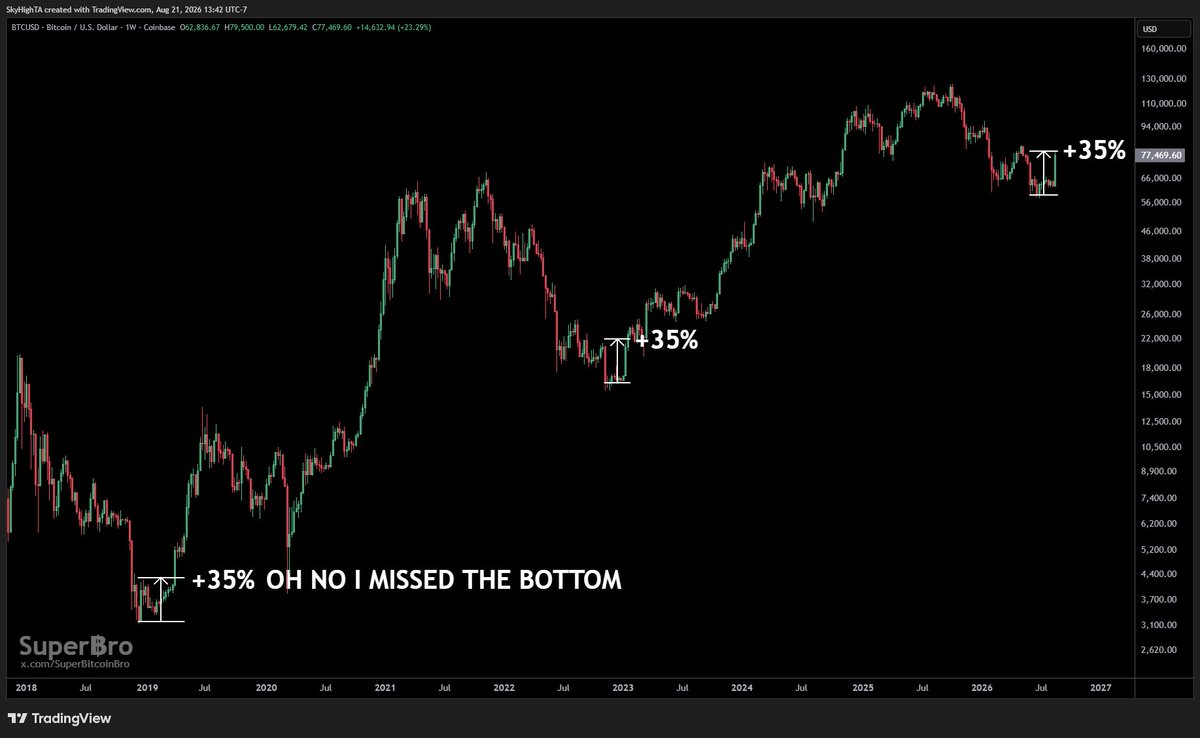
🚨 I CALLED THE BITCOIN BOTTOM.
And I used the signal everyone feared.
Back on June 29, when the weekly death cross hit, everyone screamed crash.
I said the opposite.
The 50 week crossing below the 100 week has marked every major bottom, not the top.
Since that post, Bitcoin has done exactly what history said it would.
The scariest signal on the chart was the most bullish one all along.
🚨 EVERYONE IS CALLING IT A NEW BULL MARKET.
But almost no one is watching the level that truly matters:
The 50 week moving average. The blue line.
It has called the start of every bull phase and the end of every bear.
Current 50W moving average: $81,700.
Flip it = bull market confirmed.
The tailwind for $ETH in the next few years is larger than those prior cycles of ICOs, NFTs
- expect this ratio $ETH/ $BTC to make a sizable move higher
Bitcoin had four great bubbles before the world needed Bitcoin this badly.
Now global debt is exploding, currencies are being weaponized, and governments need more money every year.
Good luck betting against the fifth.
Bitcoin was built for this.
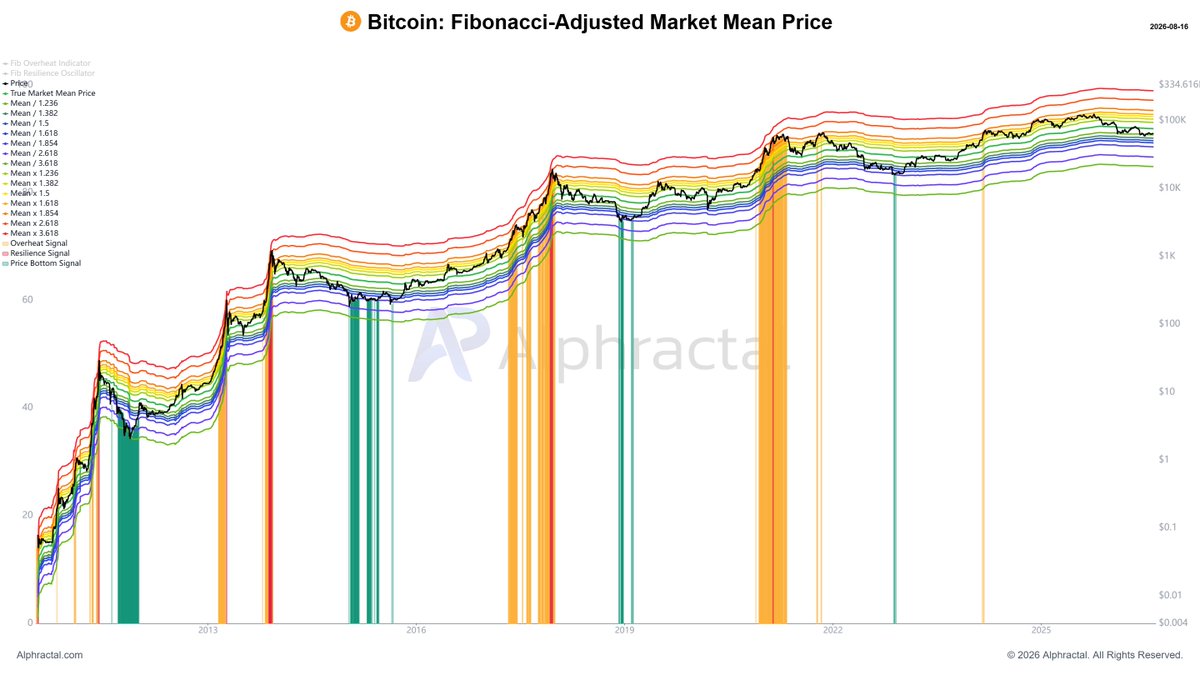
The Bitcoin Fibonacci-Adjusted Market Mean Price is approaching a region that deserves close attention.
This model is centered on the Market Mean Price and applies Fibonacci-proportional bands above and below it, creating structural zones of expansion and mean reversion. Historically, the upper bands have been associated with overheated conditions, while the lower bands have marked value zones and early accumulation phases.
And it is precisely in these blue regions that some of the best buying opportunities and major cycle bottoms in Bitcoin have appeared.
So far, BTC has not reached any of these regions yet.
But it would only take a bit more downside for that to happen if price keeps falling.
This is one of those metrics where keeping your alerts turned on makes a lot of sense.
$57,000 and below still concerns me.
Before Bitcoin formed its 2022 bottom, the market went through one final major liquidation event.
Now we are once again seeing a clear dominance of unliquidated longs over shorts.
These levels change constantly, so I strongly recommend setting alerts around the major liquidation zones and receiving notifications via Telegram or email.
If another large liquidation event comes, it could create one of the most interesting opportunities to position.
Panic and forced liquidations are often where the strongest accumulation zones begin to form.
Crypto is one of the best risk/rewards into year-end given:
- Wall Street focused on tokenization
- Clarity Act
- crypto is a downstream story of AI
$ETH
Strategy has increased its USD Reserve by $225 million. As of 7/19/2026, we hodl ₿843,775 in our BTC Reserve and $3.2 billion in our USD Reserve. $MSTR $STRC https://t.co/sci7bZHzsy
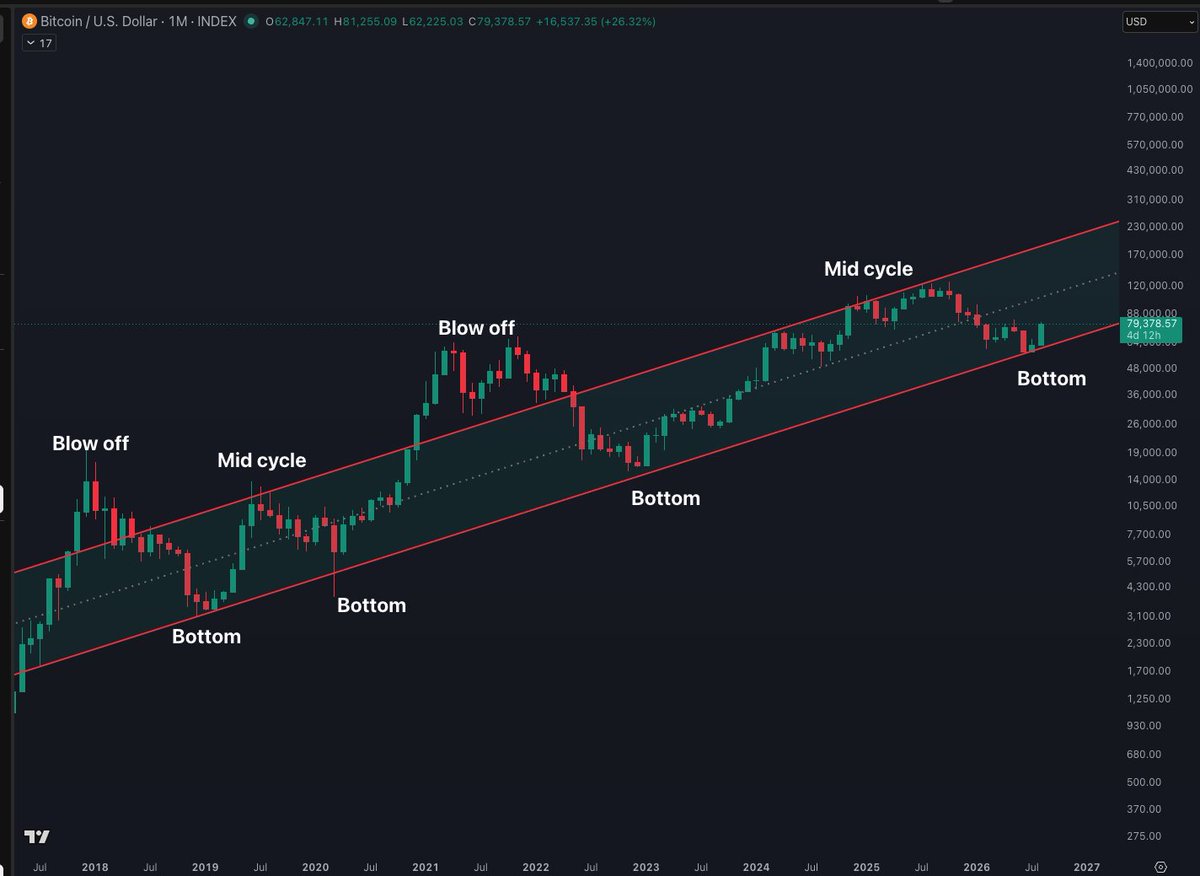
$BTC has already established its major cycle low.
The move from 97K to 59K was the final major correction.
59K is the base low. Could we wick below it? Yes. However, any move below is likely manipulation.
We're in the timebased capitulation phase.