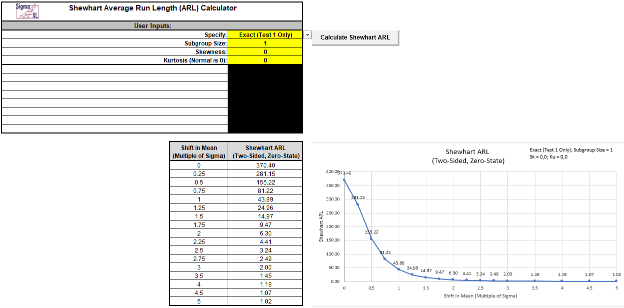
Unique to SigmaXL are Average Run Length (ARL) Calculators, which help you evaluate control chart performance and understand how quickly a chart is expected to detect a significant process shift.
With these calculators, you can estimate ARL for different chart types and shift sizes and assess how robust the chart remains when the data departs from normality.
SigmaXL includes ARL Calculators for Shewhart, Attribute P & C, EWMA and CUSUM charts. Use them in SigmaXL V11: https://t.co/cEc8AJxdZG
Want to get more insight from fewer experimental runs?
In this SigmaXL video, we demonstrate how to analyze a Definitive Screening Design (DSD) using a cake bake experiment with 6 factors and 13 runs.
See how SigmaXL helps you to identify important factors, detect curvature, and support optimization — all within one DSD design.
https://t.co/0eZ889gUfu
Did you know solitaire sparked the development of the Monte Carlo Method? During his recovery from surgery, Stanislaw Ulam, while playing solitaire, thought about playing hundreds of games to statistically estimate the probability of a successful outcome, which resulted in the Monte Carlo method of simulation. Use Monte Carlo simulation in DiscoverSim: https://t.co/2M0LUmgOF9
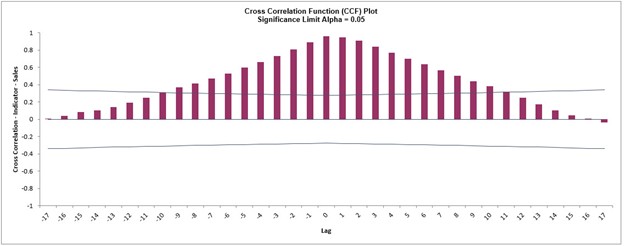
Used in Time Series Forecasting, the Cross-Correlation Function (CCF) Plot is similar to autocorrelation, but the correlations are computed on two related time series variables, typically a process input and output. This helps to identify important lags or leads in the process. Use CCF plots in SigmaXL V11 - https://t.co/ewRiXGeSQw
Discover all the Histogram options in SigmaXL in our latest video.
This video walks through the different histogram tools available in SigmaXL and shows how to choose the options that best fit your analysis. Learn how to explore distribution shape, compare by category group, and add descriptive statistics & process capability indices.
Watch now to see how SigmaXL helps you get more insight from your data with flexible, easy-to-use histogram tools.
https://t.co/NT5YN2lIMQ
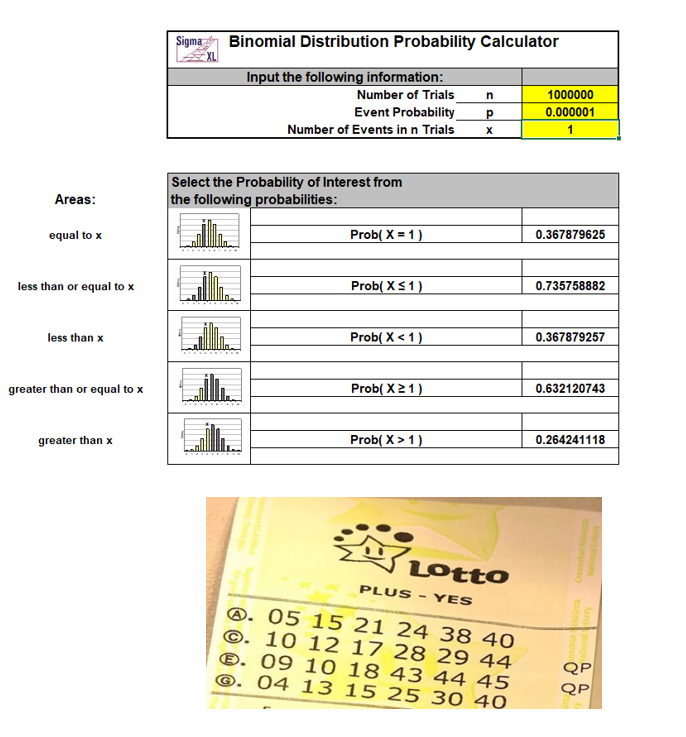
Did you know that if there is a 1 in a million chance of winning the lottery and you buy a million lottery tickets, you still only have a 63% chance of winning? You can use the Binomial Distribution Probability Calculator in SigmaXL V11 to check this calculation.
https://t.co/bMMS4A4VtX
James Lind is credited with performing the first Design of Experiments clinical trial in 1747, when he carried out a controlled experiment to develop a cure for scurvy among sailors while aboard the HMS Salisbury. Use Doe in V11 - https://t.co/QeDsX1dAnV
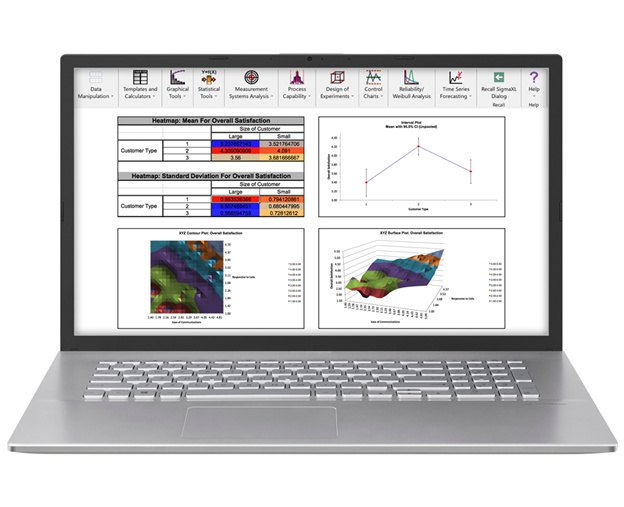
SigmaXL brings powerful statistical analysis and Six Sigma tools directly into Excel so your team can solve problems, improve processes, and drive measurable impact without a steep learning curve.
From hypothesis testing and control charts to DOE, regression, MSA, and robust graphical analysis, SigmaXL helps you move from data to action with confidence.
If you’re looking for practical analytics that teams actually use, SigmaXL is built for you.
https://t.co/qa8CFrgC0V
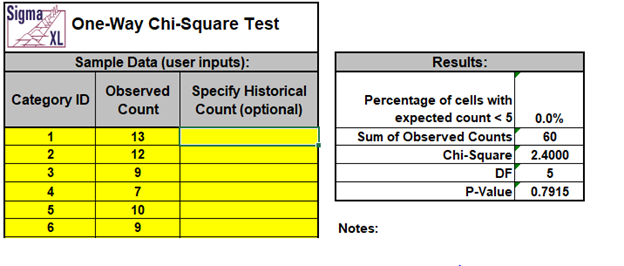
The One-Way Chi-Square Goodness-of-Fit test is used to determine whether discrete sample data are consistent with a hypothesized distribution, for example, to determine if a die is fair. For small samples, use One-Way Chi-Square Exact. These templates are available in Version 11 - https://t.co/H3IfXTDsgI
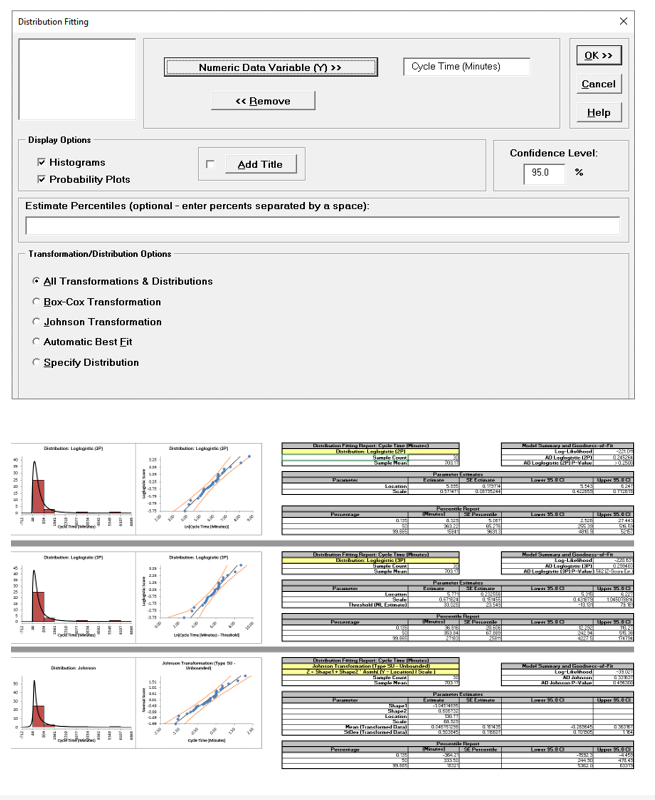
Distribution fitting is the process used to select a statistical distribution that best fits the data, assessed with the Anderson Darling goodness of fit test. This is particularly useful for process capability studies. Use it in V11 - https://t.co/747BwnV0hb
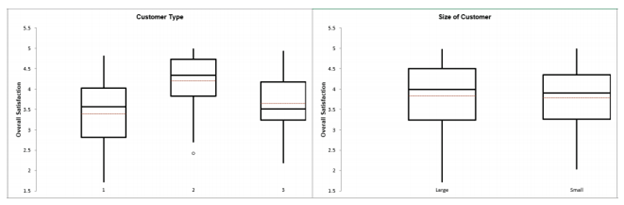
Multiple X Boxplots allow you to create boxplots with one Y variable and multiple group category X’s. A row of boxplots will be created, one for each X variable. This is useful for easy comparison of the effect of each category X. Use them in V11: https://t.co/9tjY8lDa7S
The Kruskal–Wallis test is a nonparametric method for testing if two or more samples originate from the same distribution and does not assume sample normality. If the samples have equal shapes, it’s comparing medians. Use it in V11 - https://t.co/MrgK73dtHn
Happy Holidays from SigmaXL to all our users and partners!
Wishing you peace, health, and happiness this holiday season, and a New Year filled with meaningful wins, both personal and professional.
— The SigmaXL Team
What’s more fun than flipping through a stack of Where’s Waldo? books?
Data scientist Dr. Randal Olson created an algorithm that uses the Travelling Salesperson Problem (TSP) to compute the optimal search path for finding Waldo — turning a childhood puzzle into a clever optimization challenge.
Learn more: https://t.co/yJWfi6dBX9
You can explore a similar real-world TSP application in DiscoverSim’s Travelling Salesperson case study, where optimization and simulation are used to identify the most efficient route through multiple cities:
https://t.co/Ika8GxYSP1
New Video Alert! We illustrate the use of an Advanced 2-Level Factorial/Screening Design with the famous seven factor, eight run, bicycle experiment given in the Box, Hunter, Hunter book. The response variable is the time it took to climb a particular hill in seconds. After analysis, the design is augmented to add a foldover on a specific factor to estimate it free of aliasing.
Use SigmaXL Version 11 to enhance your DOE capabilities and take your analysis further with just a few clicks;
👉 Watch now: https://t.co/btKvsJcvH6
A SIPOC diagram is a tool that summarizes the inputs and outputs of one or more processes in table form. It is often presented at the outset of process improvement efforts or during the "define" phase of the DMAIC process. Use the template in V11 - https://t.co/VmK5zdHNgU
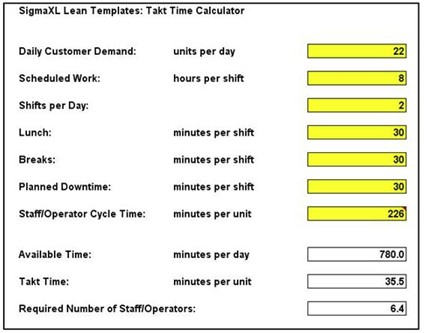
Takt time is the available production time divided by the units a customer demands. The Takt time calculator shows the optimal pace for a production process. Use the template in SigmaXL Version 11 - https://t.co/2rSc8oebHd
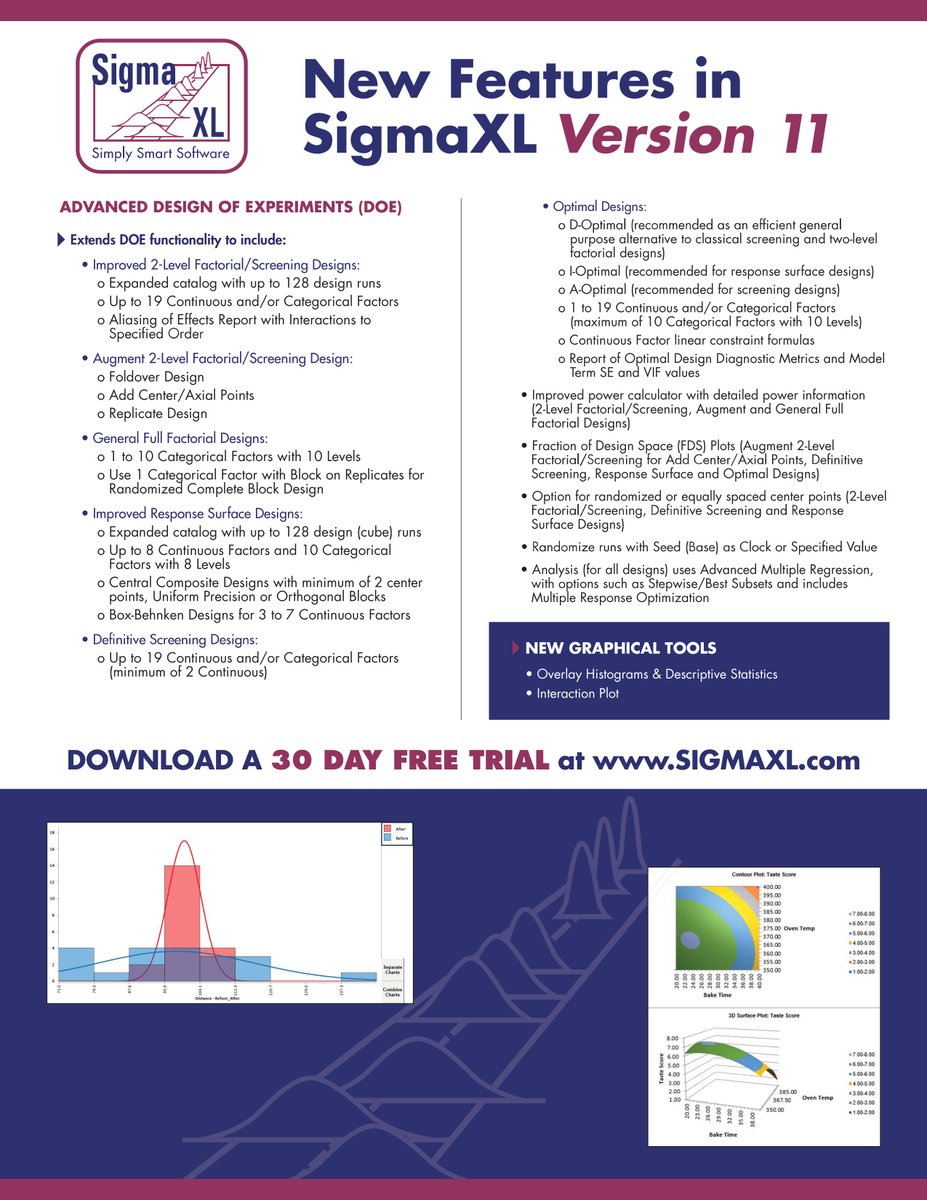
What’s new in SigmaXL V11? 🤔
➡️Advanced DOE designs
➡️Better activation & license manager
➡️Compare with Overlay Histograms
Download the trial today and see the difference! #DOE#LeanSixSigma
https://t.co/fNQuRgn7Rq
New Video Alert! Learn how to augment your factorial design with axial points to bake a better cake. Use SigmaXL Version 11 to enhance your DOE capabilities and take your analysis further with just a few clicks;
👉 Watch now: https://t.co/JO9iOi7bYD