MY TRADING PLAN.
This is a very simple depiction of my Trading Plan:
- When I have a bias
- Internal to External Range Liquidity play (MMXM)
- Executing with Inversion or Breaker + FVG
Simple makes more money.
3.3 Volume
If a Bullish Breakout is driven by Stops being triggered and not new willing buyers, breakout is going to fail.
In a Bearish Breakout, if no new sellers are trading the breakout, what will drive price lower?
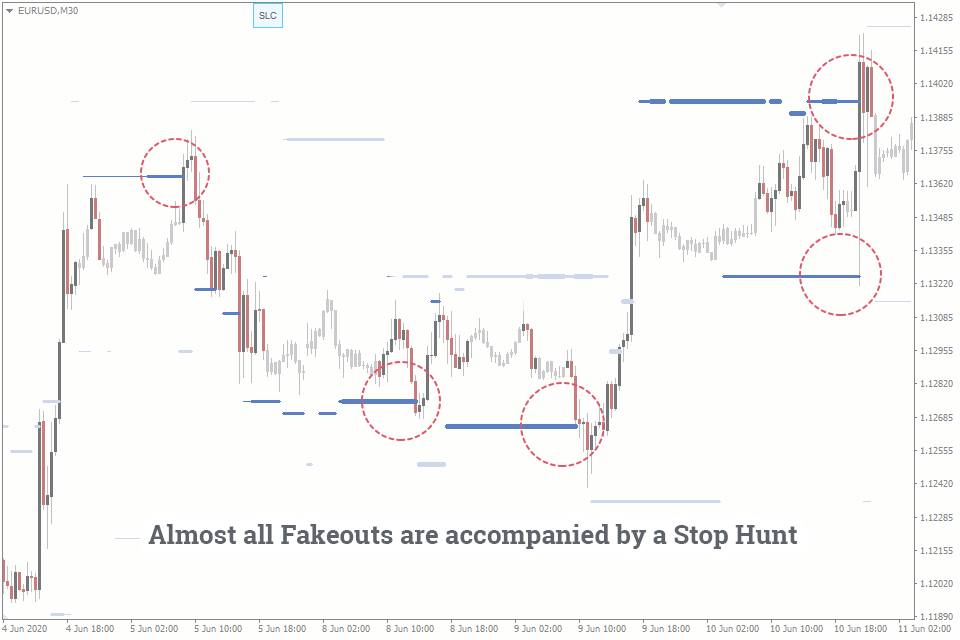
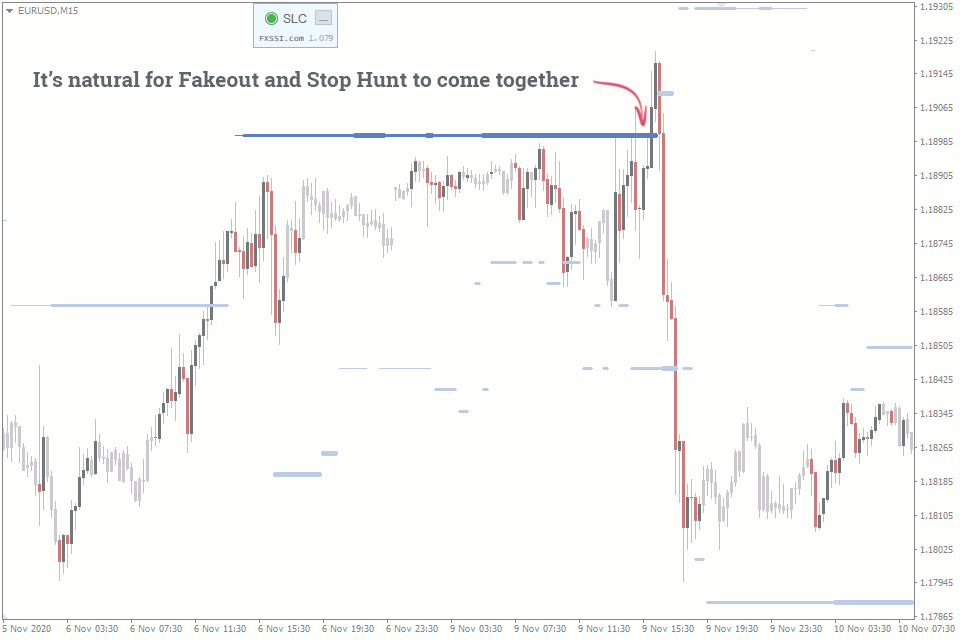
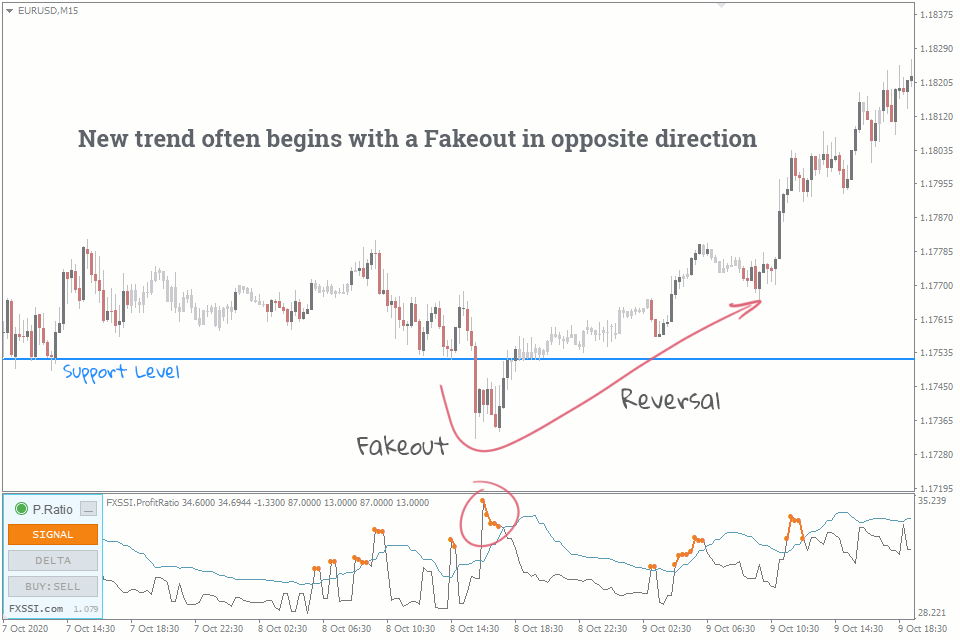
Fakeouts are nearly always accompanied by stop hunting.
3.2 Volume
Stop hunting is when the volume and price change during trading, triggering Stop Losses that drive up volatility.
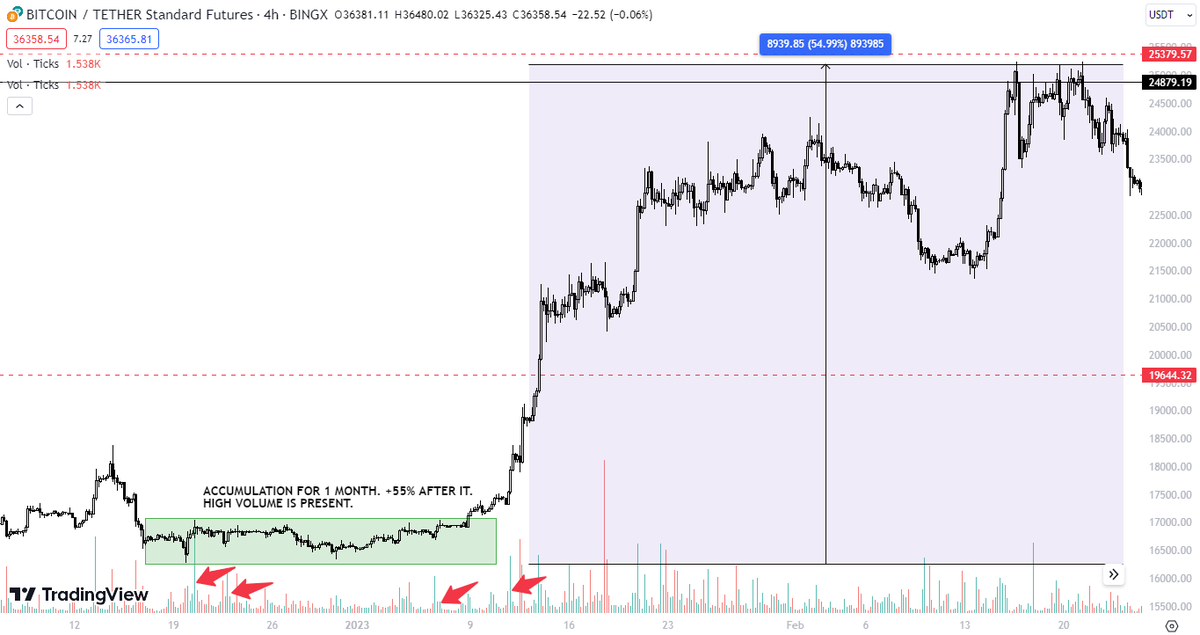
Low volume during a breakout attempt often signals a lack of market conviction, making it more likely that the breakout will fail.
3.1 Volume
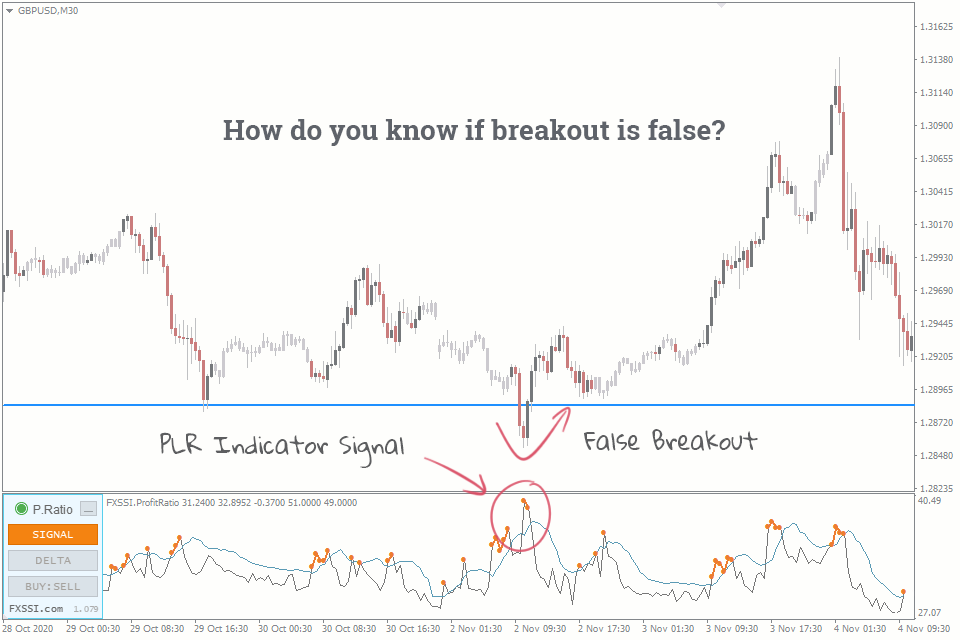
How do you know if a breakout is false?
Using certain Indicators such as RSI, MACD or CVD will help you identify a reversal.
Volume is the key in identifying the strength of a trend.
Measure the volume that is flowing in a chart, to know if its a breakout or not.
3. Volume
When you are trading using Volume, understanding how to differentiate a true breakout from a Fakeout is crucial.
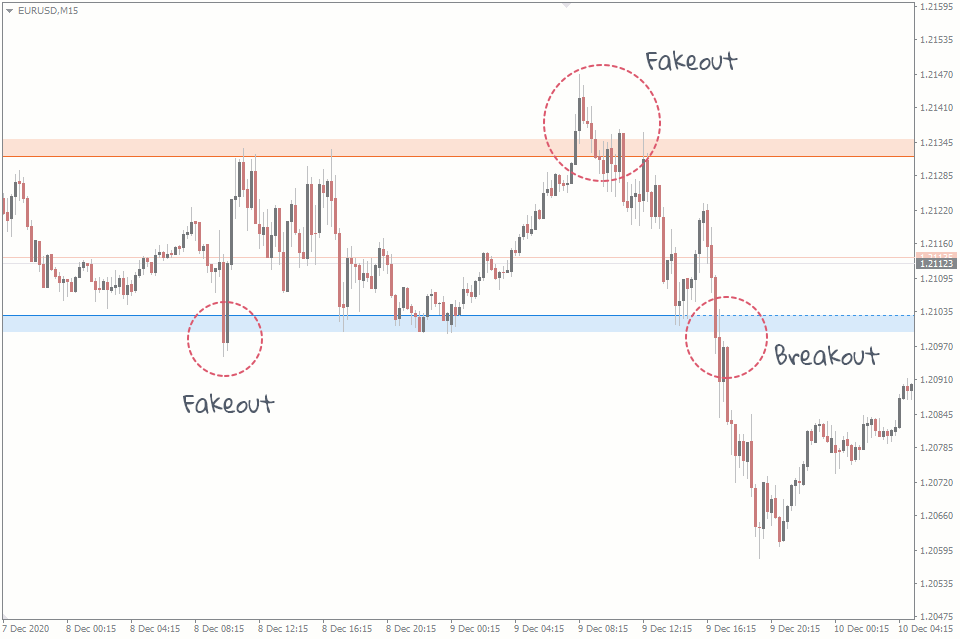
Fakeouts is where a price breaks through a Support or Resistance Level but then reverses back. This can trap traders who enter too early.
2.5 PO3
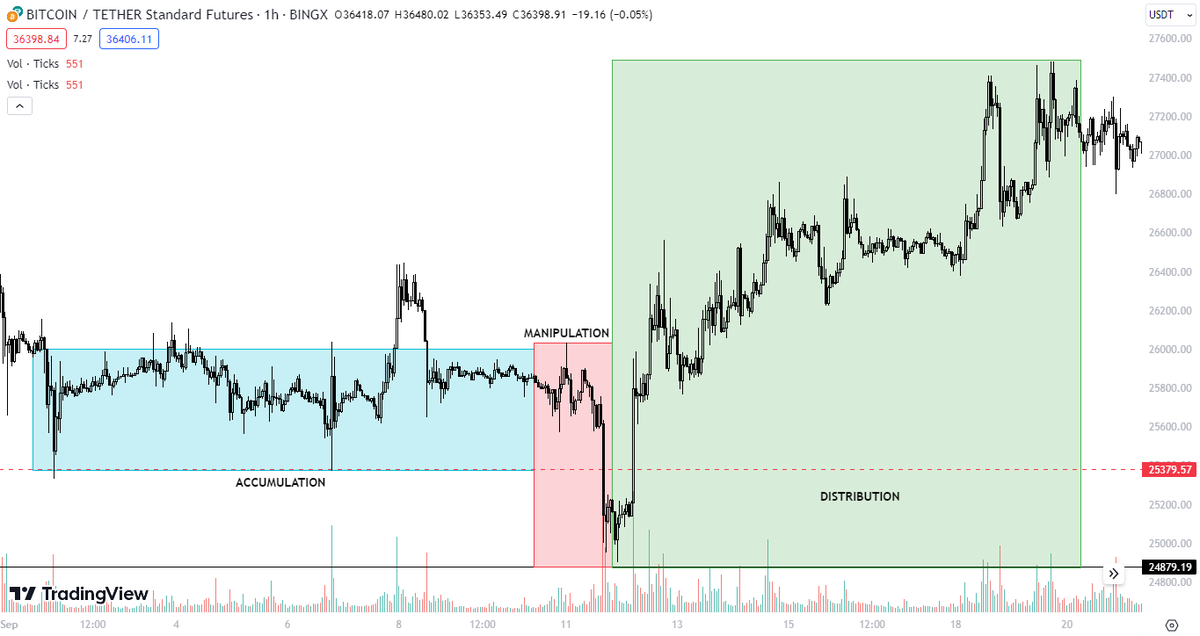
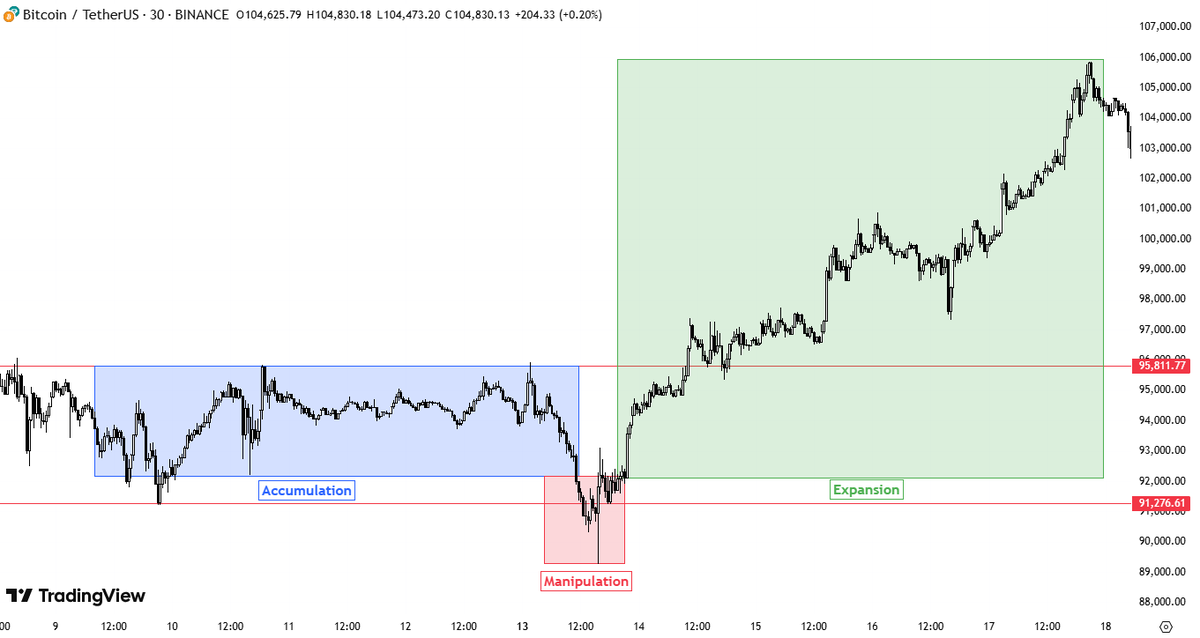
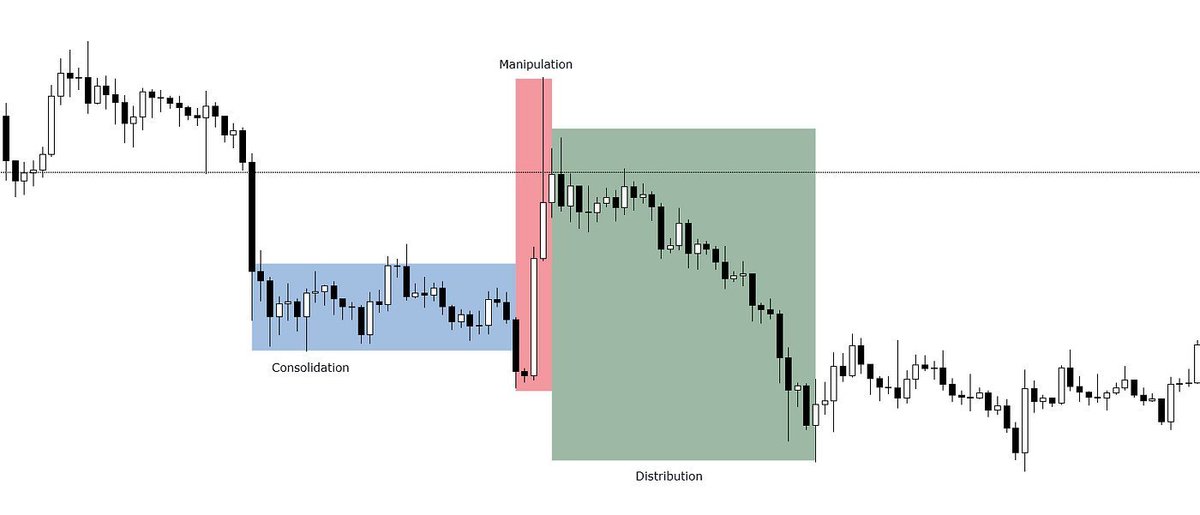
Bullish PO3 is conformed by
1. Accumulation: Longs are building up and price is in a range
2. Manipulation: Market sells of below the range, creating liquidity
3. Distribution: Price expands upwards, breaking MS with strong bullish candles and bullish volume
2.4 PO3
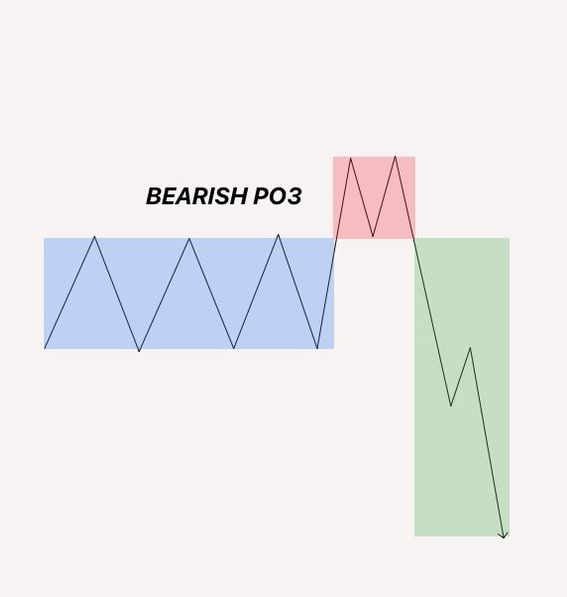
Bearish PO3 is conformed by:
1. Accumulation: The price enters in a range
2. Manipulation: The price aggressively rallies above the range, creating liquidity above last highs
3. Distribution: Price expands downwards, breaking the MS with strong bearish candles
2.3 PO3
Manipulation is where price deliberately move in a false direction to trick traders into taking the wrong position or getting knocked out of their positions
This phase is seen as being characterized by sharp, misleading price movements aimed at manipulating liquidity.
2.2 PO3
"Distribution Zone" refers to the phase where market manipulation by institutional traders begins to distribute their accumulated positions.
This phase is characterized by price movements in the opposite direction of the initial manipulation.
2.1 PO3
The Accumulation or Consolidation phase is the first step of the Power of Three.
Where institutional traders begin to build their positions without causing major price moves.
This phase typically occurs in a period of consolidation or range-bound trading
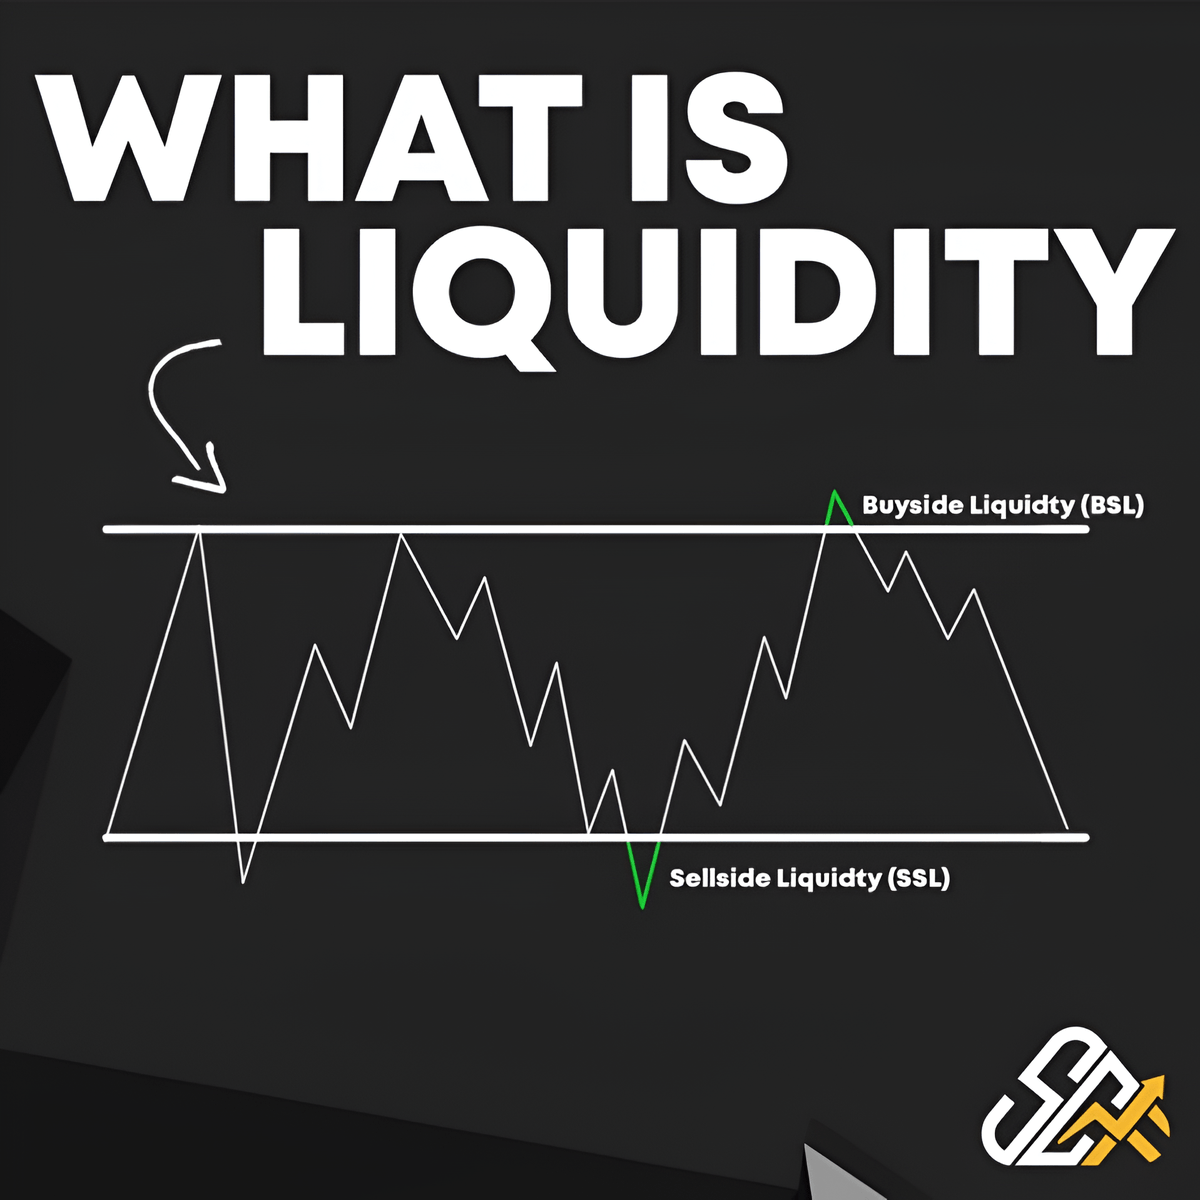
1.3 Liquidity Sweep
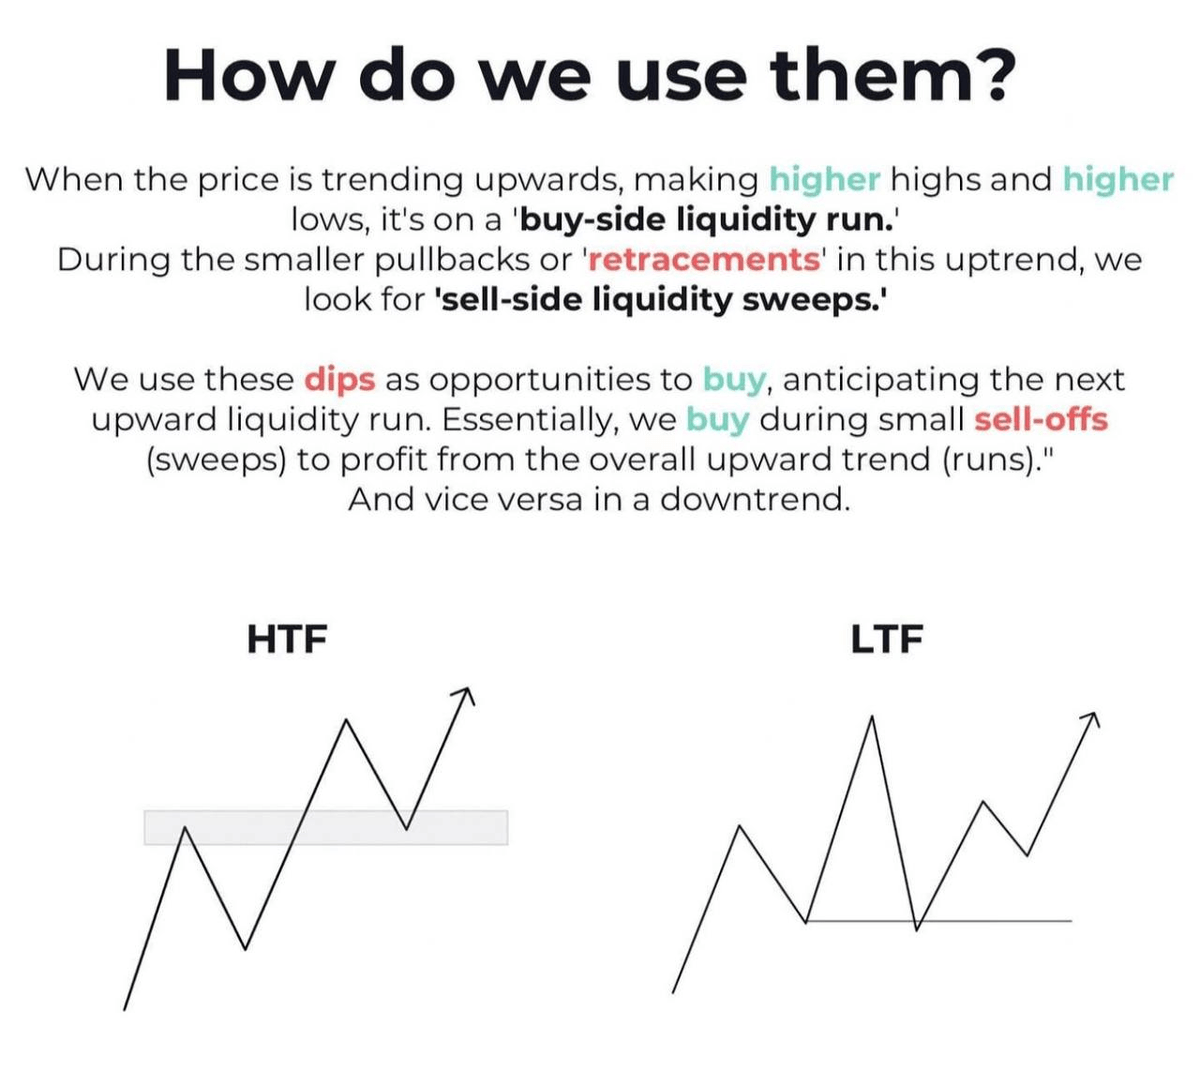
In a Bullish trend, a Liquidity Sweep is when price dips below a swing low, trapping sellers before reversing up.
A Liquidity Run is when price breaks above a Swing High, signaling continuation higher.
HTF trends are easier to identify than LTF
1.2 Liquidity Sweep
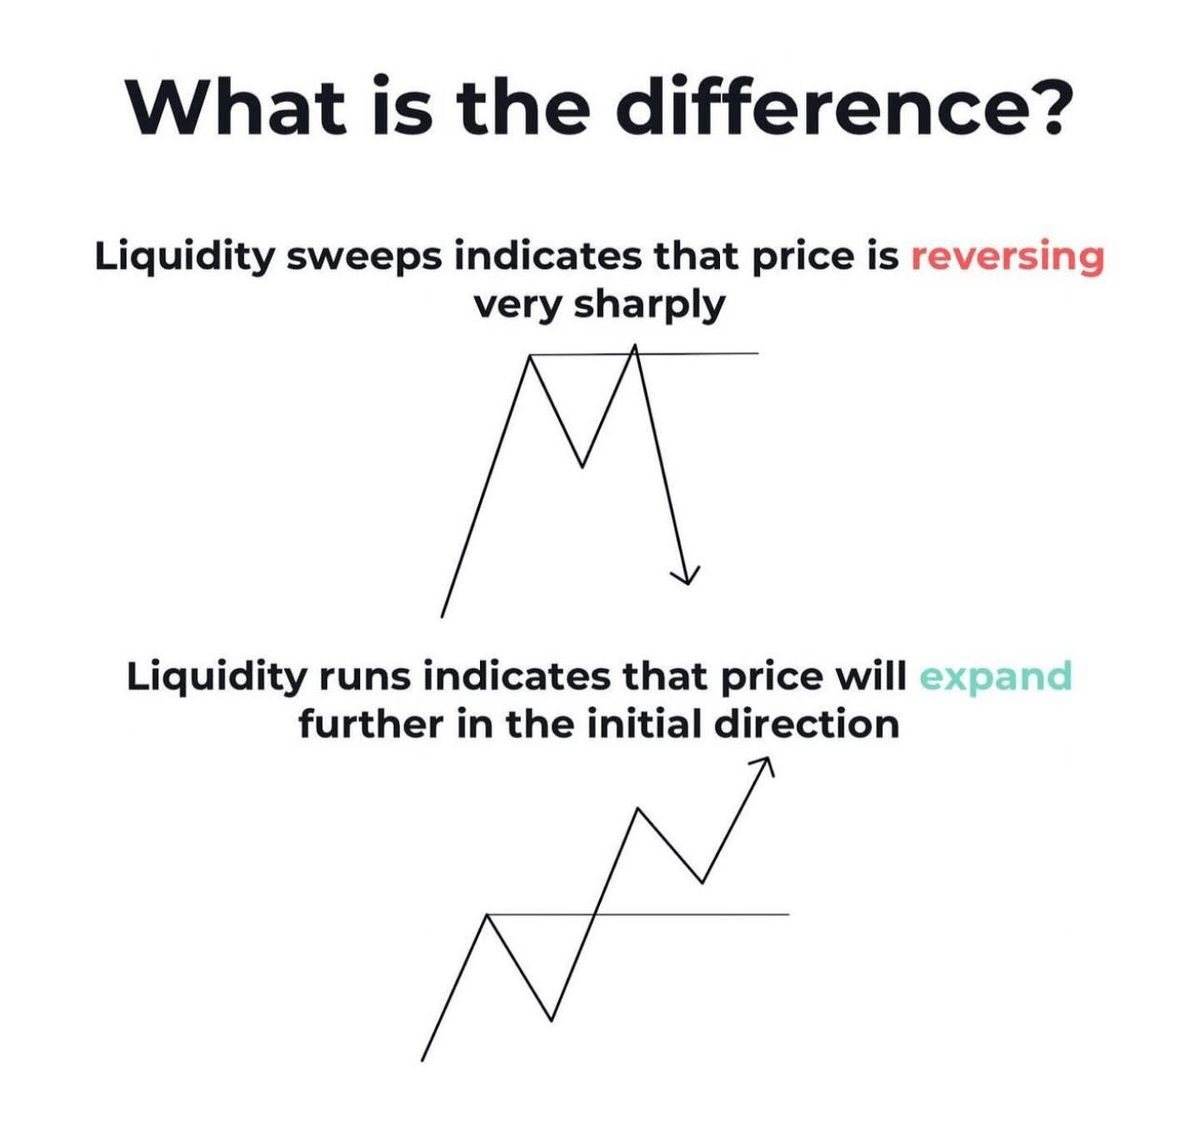
A Liquidity Sweep targets a specific level to trigger stop orders and cause a reversal.
A Liquidity Run moves in one direction without reversing gathering Liquidity before making a major move.
It is seen as a continuation of the short term trend.
1.1 Liquidity Sweep
Liquidity Run occurs when the price moves in the direction of the prevailing trend.
Liquidity Run refers to a situation where the market price moves persistently in a single direction, consuming or "sweeping up" liquidity along the way.
1. Liquidity Sweep
A Liquidity Sweep occurs when large market participants activate significant orders within Liquidity Zones.
This causes rapid price movements
In 4 hours, we're beginning the price increase of The Real World⌛️
Most people think TRW is just a platform that teaches how to "make money online."
However, it's much more complex, and we offer many features that most people don't even know exist.
Here are some of them: