$BTC: At 60k I have been telling 79-85k is coming
Everyone else was shorting at 60k instead!
I bought spot at 68k and longed 71k instead!
Tell me who was right again and again?
The best TV series for every year since 2000. 🍿🎬
Solid list 🔥
2000 – The Sopranos
2001 – The Sopranos
2002 – The Wire
2003 – The Wire
2004 – Lost
2005 – Prison Break
2006 – The Wire
2007 – The Sopranos
2008 – Breaking Bad
2009 – Mad Men
2010 – Breaking Bad
2011 – Game of Thrones
2012 – Breaking Bad
2013 – Breaking Bad
2014 – True Detective
2015 – Game of Thrones
2016 – Stranger things.
2017 – The Handmaid’s Tale
2018 – Succession
2019 – Chernobyl
2020 – Succession
2021 – Succession
2022 – The Bear
2023 – Succession
2024 – Shōgun
2025 – The Bear
NB: Based on global recognition.
Bitcoin has dropped below @Strategy's cost basis, currently showing a ~$1.5B loss.
Will they sell?
In 2022–2023, @Strategy's $BTC holdings were in the red for over 500 days.
They sold 704 $BTC only once on Dec 22, 2022, and quickly bought back 810 $BTC afterward.
Aside from that, they've been strictly buy-and-hold.
hm…. about $TAO @eliz883 … probably its one of the best #ALTCOINS imo but only if you know like when to add for long term….
i’m bullish about it… but still thinks the fair value for buying #TAO is 100$ - 90$ (possibly wick lower to 60$)
because already bearish on 3M TF… it tried to reclaim on monthly TF but rejected and still going lower…
so we’ll see bro… we’ll see…✍️
Bitcoin dominance has been struggling to reclaim the 200D SMA and 200D EMA levels.
This is a good thing for the alts, but here's something concerning.
Since September, Bitcoin dominance has been consistently forming higher lows.
Until this changes, most alts will continue to underperform despite $BTC bullish price action.
BITCOIN IS TRACKING LIVERMORE’S LEGENDARY ACCUMULATION CYLINDER.
Accumulation. Breakout. Vertical Phase.
And the crazy part?
Most people won’t believe it…
until it’s already up 50–100%.
Miss this phase and you don’t miss a trade…
You miss the run.
Structure over opinions.
BULLISH MOMENTUM IS BACK 🟩
US CPI data indicated the possibility yesterday.
The numbers point towards rate cuts.
A phase which we can call a mini Altseason.
Some humble targets for the next move :
$LINK : $30
$TAO : $600
$SEI : $0.40
$SUI : $4
$SOL : $250
$HBAR : $0.35
$HYPE : $60
and more....
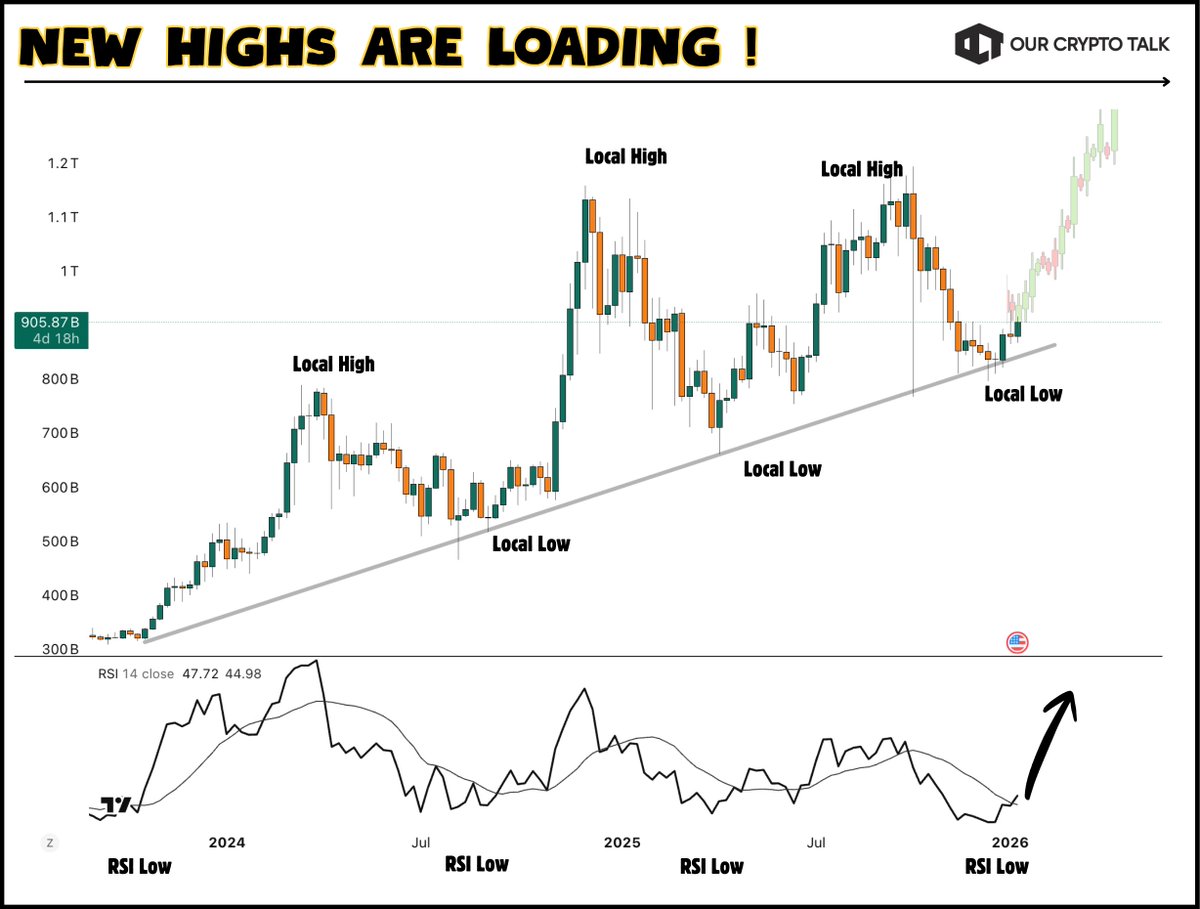
Now let us dive into the analysis and potential bullish factors so you do not miss this opportunity
👉 THIS IS A TEXTBOOK HIGHER-LOW STRUCTURE
Zoom out and ignore the noise.
Every major correction on this Total3 chart has done the same thing:
• Price makes a local high
• Pulls back without breaking trend
• Prints a higher low
• Then expands again
That grey trendline has been respected since early 2023. Not once has it failed. Even the recent dip found support exactly where previous uptrends restarted.
Markets that are preparing for new highs don’t collapse from strong support.
They pause, reset sentiment, and then move when most people least expect it.
👉 RSI IS RESETTING, NOT ROLLING OVER
Now look at RSI.
Every time RSI reached these low zones in the past, it didn’t signal the end of the trend. It signaled fuel being reloaded. Each RSI reset was followed by a strong expansion phase in Total3.
We are sitting at that same RSI low again.
That’s important because bull markets don’t die with RSI resetting at support.
They die with RSI staying overheated while price goes vertical. That’s not what we have here.
This is calm before acceleration.
👉 MACRO IS STARTING TO HELP
Now add the macro layer.
Core CPI at 2.6% is the lowest inflation print since March 2021. That puts real pressure on the Fed to ease further. And markets know it.
Every time CPI comes in lower than expected, risk assets react first. Bitcoin has already shown that by breaking above $94K.
Crypto doesn’t wait for official policy changes. It front-runs them.
If rate cuts accelerate, liquidity flows.
If liquidity flows, altcoins outperform.
And Total3 is the chart that shows where that money goes next.
This is how FOMO starts quietly.
Not at the top and definitely not after headlines.
But when structure is intact, macro turns supportive, and most people are still hesitant.
New highs don’t announce themselves.
They load while doubt is still loud.
And this chart is telling you exactly that.
$ROSE is relatively safe hold (imho)!!!
The macro ABC target is reached.
Could go sideways for a while before the next impulse.
Since all the PA from the beginning has been (mostly) corrective, we could get the first REAL bull for this project soon!
I'm expecting $1-1.5 target for #ROSE
Not financial advice!
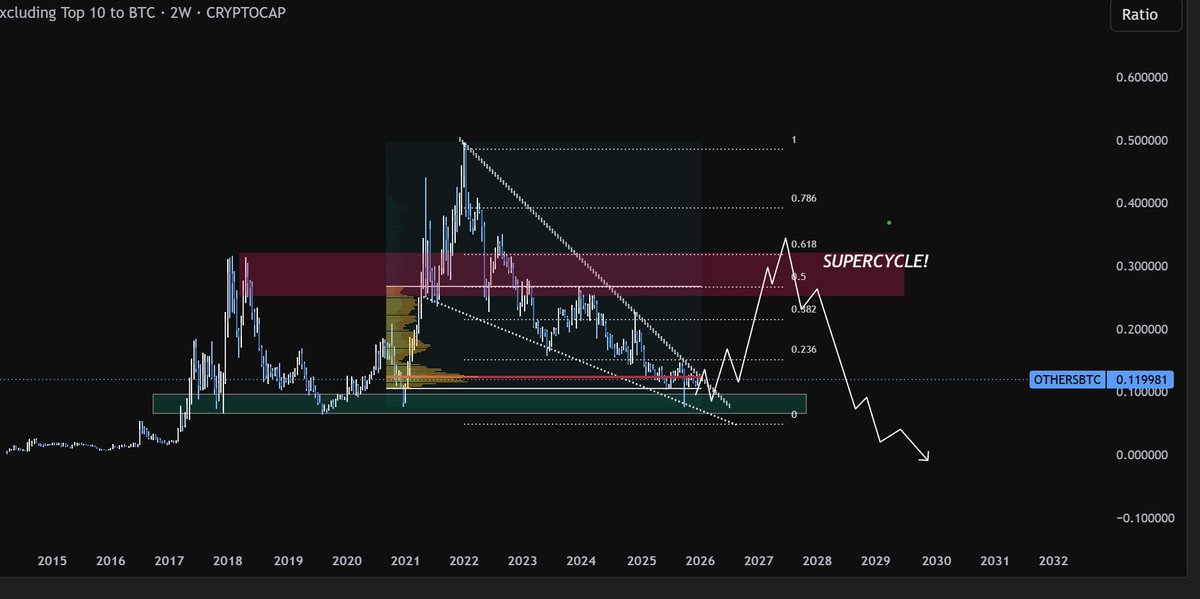
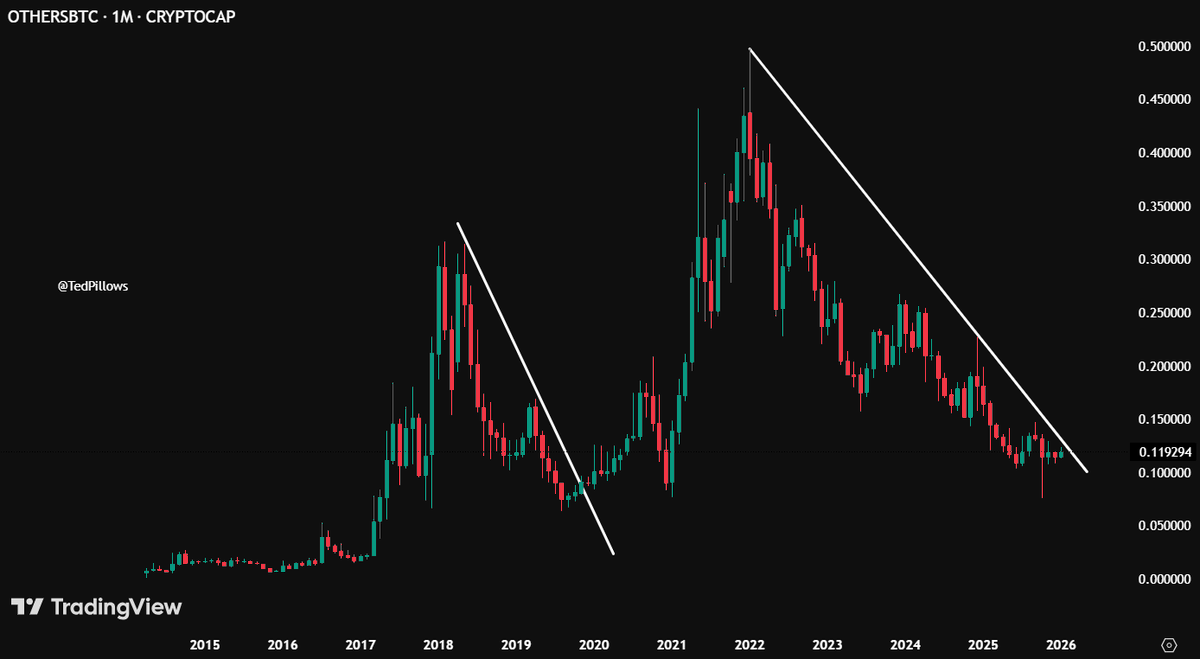
$OTHERS . My Take on ALTCOIN SEASON.
If we get a final move with $BTC , I believe alts will rally hard this time. HOWEVER :
- The pump will "Just be " a retracement toward 0.618 fib , Potentially surpassing it and causing a deviation/trap. In that case, everyone will start to call for the superseasoncyclealtcoinseason 20x to the moon.
Instead, that will just the final trap before Lights out.
In saying that .. many altcoins could do a 5-10x .
#bitcoin #altcoins #alts #crypto #ETHUSDT
Alts have been in a downtrend against BTC for 4 years now.
Every small pump and the people have called for a 100x AltSeason.
If you truly want AltSeason, watch out for a breakout here.
If that happens, Alt/BTC could enter a multi-year uptrend.
$TOTAL
The $total cryptocurrency market capitalization has closely adhered to Elliott Wave principles throughout the current cycle.
We are presently navigating a corrective phase (likely an ABC structure following a completed five-wave impulse).
Anticipating a Wave B counter-trend rally toward $3.4T, followed by a Wave C decline targeting approximately $1.87T
This final Wave C leg is projected to establish the cycle bottom for Bitcoin around $54,000
Bias: $TOTAL market cap will be bullish for short term (til FEB) then dump
#BTC #bitcoin
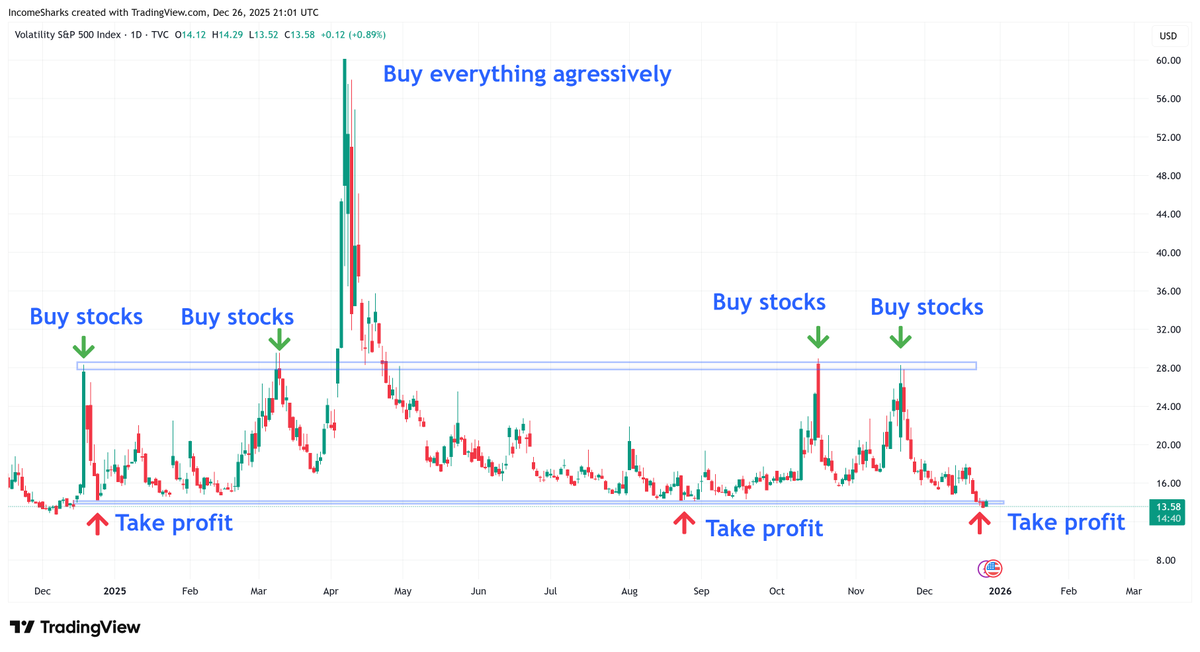
$VIX - Lowest we've seen all year. It spent one day below the line before immediately bouncing back up. Will be interesting to see if we can finish the year with it just chopping.
Gold at ATHs
Silver at ATHs
Platinum at ATHs
S&P at ATHs
Bitcoin −30%.
Alts −90%.
This might seem bearish. And yes, we are probably not out of the woods yet.
But there is actually some evidence (and logical explanation) that this is quite normal and happened before.
You know I always look at price action today, and not previous cycles.
Hence my short term bearish stance when Bitcoin lost ~100k a few weeks ago.
BUT:
2019-2020 gold broke out to new highs while stocks grinded higher. All while btc was down between 50-80% (alts even more).
BTC lagged and reacted after the liquidity response.
2010-2013 a very similar reaction. Gold went parabolic, stocks recovery ripped and Bitcoin lagged BUT exploded in 2013 post gold run.
I don't really like this example the most as it was really early days for crypto but nonetheless.
Early 2020 also a mini-cycle where gold went strong into a crisis and BTC crashed harder than stocks.
But it massively outperformed after the ACTUAL easing (not upcoming or hinting).
This goes well with an actually fact and proven thesis:
Metals rally during fear.
Stocks ignore it.
Crypto waits for liquidity (actual easing).
Then why is everyone getting it wrong and do we continue to bleed lower and lower?
Simply because they are calling for it to soon. There is NO actual easing yet (tightening has stopped. But real easing hasn't begun yet).
It's also incredibly difficult to put a timing on it yet everyone does it (Q3 fam! Q4 will be insane! Q1 will be parabolic! And so on and so on)
There where I personally like to add price data into the mix.
For me it's incredibly simple:
If price doesn't turn bullish yet (alts literally are making new local lows every week) it simply doesn't yet.
There might be plenty of signs of better days ahead. But unless I see the turnaround, I don't think it's the time to go yet. Simple.
It might actually still get worse before it gets better (especially in my perspective if we lose $85k).
I do see plenty of opportunity and a future for us ahead here.
But that doesn't mean it always starts tomorrow (adapt to price short term instead of only aligning to macro).
I'll be here 🤝
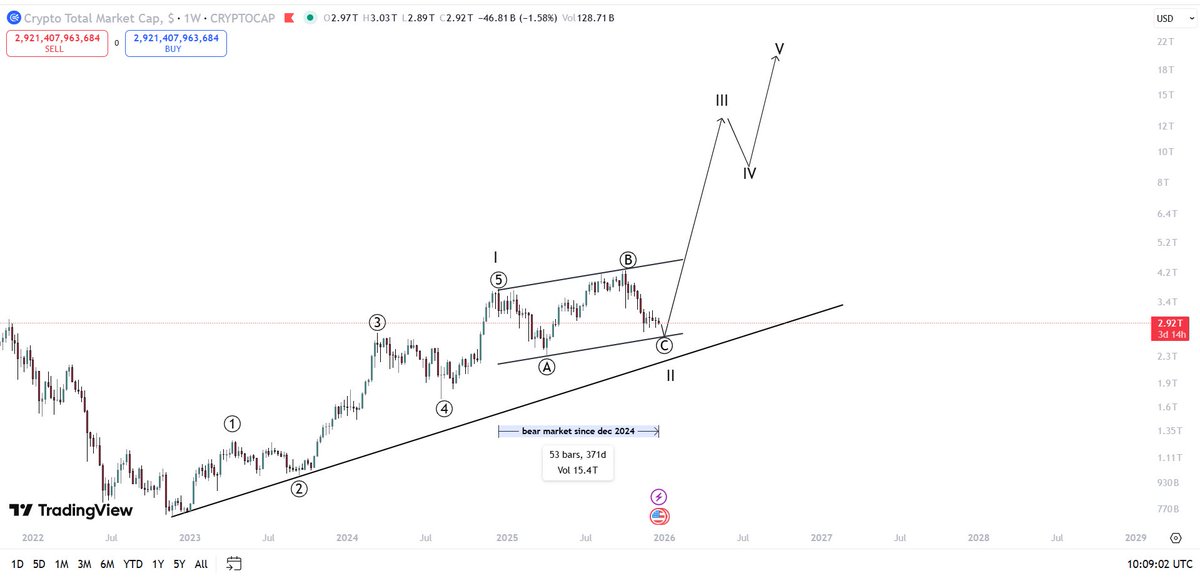
detailed analysis for TOTAL #CRYPTO MARKETCAP… and probably the last chart for some time…
imo same like… #ALTCOINS marketcap…
total #crypto marketcap was also trading in a bear market since last year (dec 2024)…
reason - like you can see #ALTS completed its 5 waves up in dec 2024… same like #ALTCOINS marketcap…
and when a cycle complete’s 5 waves… it starts ABC correction (3 waves down correction phase) or bear market…
like you clearly see in #Alts market-cap chart “OTHERS”…
now some people say like if the top was in dec 2024… then why $BTC and total #CRYPTO marketcap gone for another high in october 2025…
then here’s your answer….
they are possibly in a running flat or expanding flat abc correction since 2024…
where B wave goes higher than a wave 5 (a fake out pump) before going for C wave…
so there are 2 scenario i have in my mind for TOTAL #CRYPTO MARKETCAP…
FIRST SCENARIO 👇🏻 (1st left pic)
total #crypto marketcap is in a running flat correction…
what could be completed when it touches the bottom its ascending channel in coming days around 2.62T (monthly support)…
before continuation for its bull cycle wave 3 to all the up….
2nd SCENARIO 👇🏻 (2nd right pic)
according to this scenario its possibly in expanded flat correction since dec 2024…
where “A WAVE” completed in april… then WAVE B happend in october 2025…
now its on a final WAVE C for completing its correction scenario what could end around 2.3T - 2.2T around its long term trendline…
then a mega WAVE 3 run… to new highs around 10T+ - 24T marketcap….
nearly both scenarios are looking attractive imo…. and rhyming with #ALTCOINS marketcap..,,
just wanna say one thing.. market will never go with majority.. it always perform against the majority….
lets see how it goes….
#BITCOIN #ALTCOINS