📌 Trading Rules That Keep You Alive
👉 Use Only 0.21% to 2% Protect your capital first.
👉 Use 20x – 50x is the sweet spot.
👉 Respect the plan. Entry & SL with TP
👉 Discipline wins. Skipping trades is better than forcing wrong ones.
👉 For VIP DM Telegram @SmEnroz
• Dips offer positioning, not excuses
• Structure matters more than candles
• Patience pays when volatility spikes
You do not chase tops. You do not fear red. You stay disciplined and wait for confirmation.
This is how winners are built in crypto.
If you chase hype without checking the data, you risk losing everything.
Real traders focus on structure, liquidity, and supply transparency not on hot listings or social media buzz..
$COAI made one of the biggest crashes this year.
You saw the hype. Now you see the truth.
Price moved from 0.13 to 44.90.
Today it sits near 0.52.
This drop shows how fast a hype token can die.
👉 The token surged from near $0.13 to a peak of $44.90 in a few weeks.
What it shows?
This isn’t a story about innovation or fair growth. It’s a classic token pump and dump.
Big wallets drove price up. Retail FOMO followed. Once insiders sold, price collapsed leaving late buyers stuck.
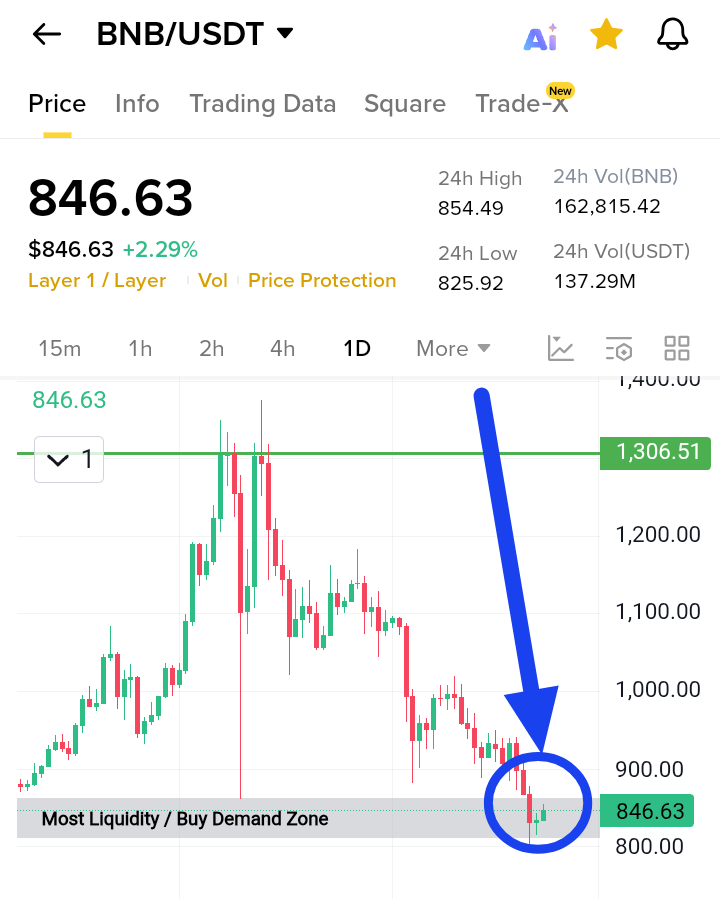
$BNB trying to push. Buyers already active. You can see it in the candle and the volume.
Price holding above 846 shows buyers want control.
Short timeframes show steady demand.
If buyers keep this pressure, it try to move toward 860 again.
If volume drops, price can slip back
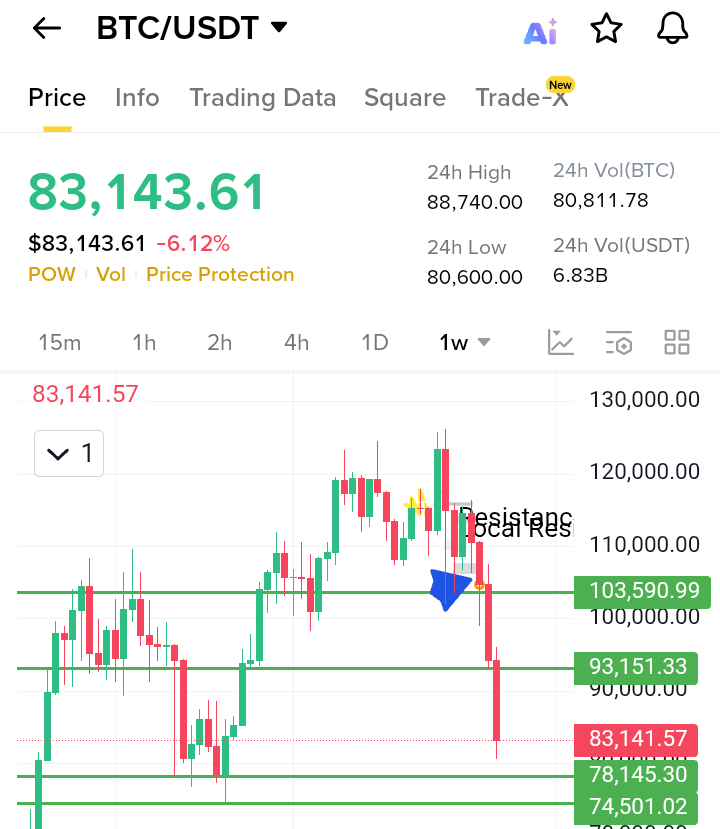
If buyers defend 74500 to 78000, BTC can take liquidity and push for a new ATH.
You watch two paths.
Break the zone and fall.
Hold the zone and bounce.
$BTC is now trading close to the major support zone at 74500 to 78000. This level protected the chart many times in the past. If price loses this zone with strong volume, you can see a fast drop toward 57000.
What you should do
• Watch if price holds 93100 USDT a clean bounce here means strength.
• If it breaks below, look for move toward 78000 USDT zone.
• Use the lessons you learned patience structure confirmation.
Keep accumulating knowledge.
You may have spent years in the crypto market.
That alone doesn’t guarantee success.
What truly matters is this
• Every move of Bitcoin teaches you a lesson.
• Even when you feel lost, you still learn.
• Market structure, momentum loss, support break these build your edge.
What BTC’s current movement shows
Bitcoin is hovering near 93100 USDT while traders watch the 103590 USDT resistance.
Institutional flow data and onchain indicators show weakening momentum.
Support zones that mattered are being retested. A break could shift market structure.
$XRP is now sitting on its last strong support at 2.10 to 2.06.
This zone decides next move. If buyers defend it, you can see a push back toward 2.51 as an average recovery move.
If the price gives a fakeout under 2.06,The market loves to remove weak positions before real move
The market is running with high volatility.
BTC is moving between 93,151 and 91,565 with no clear direction.
You can see the pressure from the last rejection near 103,590.
Some people say this drop is already deep.
Some people say the market will crash more.
You look at the chart and see a different picture.
You see it needs a deeper sweep to build a strong base.
If BTC dips below 91,000 and grabs liquidity, the structure becomes cleaner for the next strong push.
A proper correction creates the chance to reach new highs again.
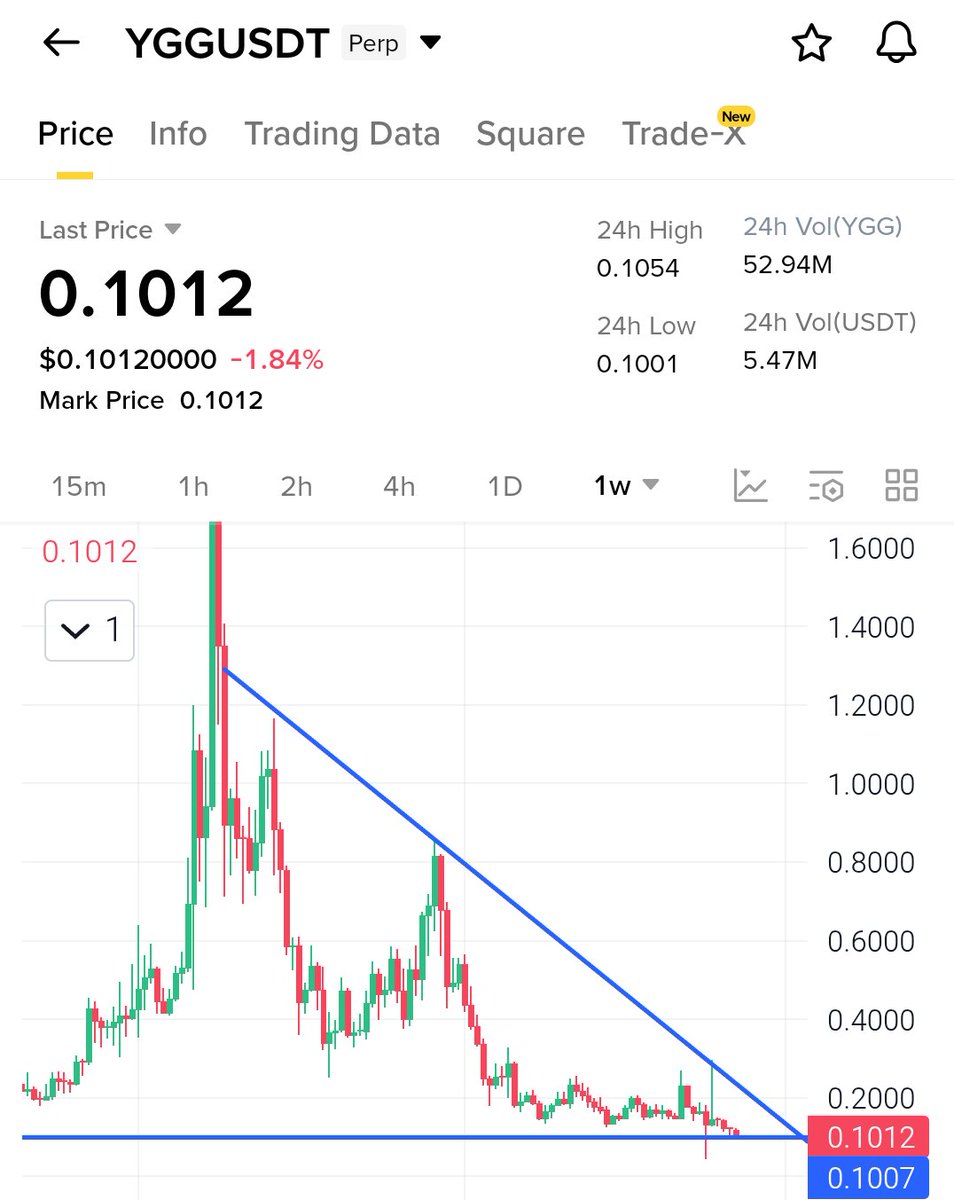
$YGG (1W chart – long-term compression at major historical support)
On the 1-week timeframe, @YGG_Play has been trending downward for an extended period, respecting a clear descending trendline that has guided every major lower high. Price has been falling
#yggplay
Here’s a clean, expert-style post:
BTC is holding on key support around 103.5k–104.5k zone.
Buyers are trying to defend this level after heavy selling pressure.
If this support breaks, downside momentum can extend fast.
If it holds, short-term relief bounce likely.
But if it breaks $1.22 to $1.25, recovery can push it back toward $1.60 to $1.70.
Right now, it’s standing at a critical point watch the support and resistance carefully before taking any move.
$Aster showing negative impact in the market.
It’s building base support around $0.85 to $0.94 on the daily timeframe. Indicators are turning bearish and showing signs of momentum shift.
If #Aster loses $0.85 support, the next zone could be $0.40 to $0.50.
$XPL has successfully hit its full take-profit (TP) target at $0.3455! 🎯 The trade has been completed perfectly, reaching the final TP level.
🔑 Key Levels:
Entry: $0.3549
1st TP: $0.3500
2nd TP: $0.3470
Full TP: $0.3455
Congrats to those who followed.
#plasma@Plasma