We scan thousands of US stocks so you don’t have to.
Sniper Alpha looks for momentum, strong trends, and clean technical structures before they get crowded.
Basic → broader stock discovery & screener research
Elite → selective setups, trade plans & position management
Not every candidate becomes a setup.
The job is to find them early — then let price confirm.
No valid setup. No trade.
↓ See how Sniper Alpha works
https://t.co/QSOP35Tvvh
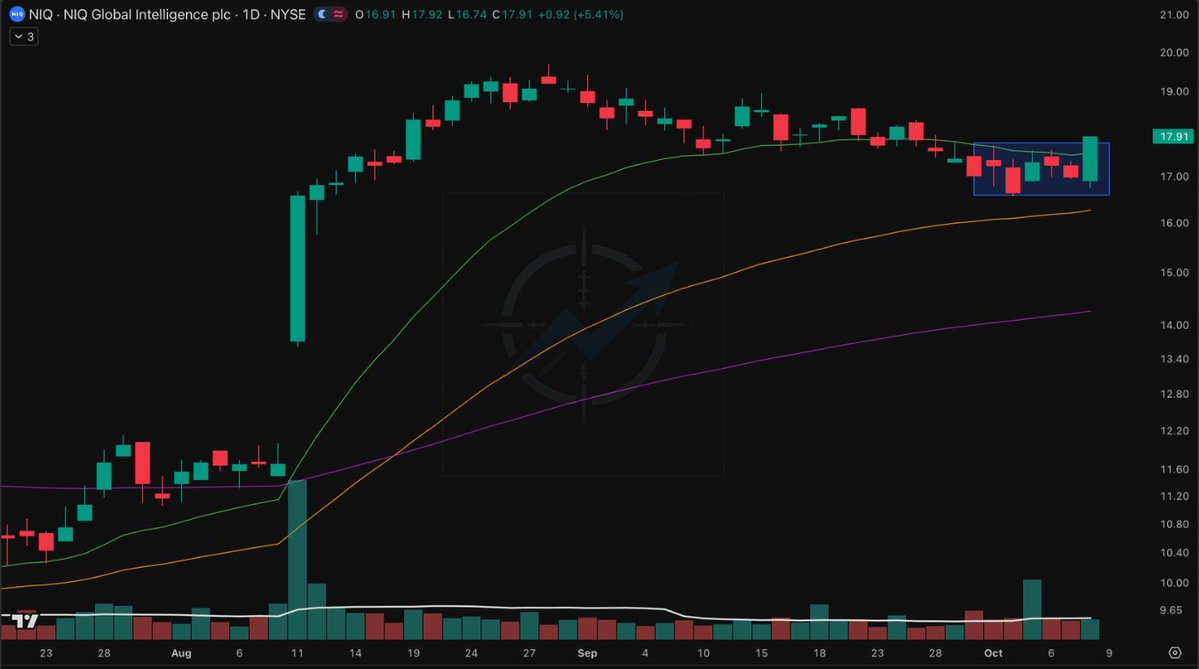
$NIQ — Quiet pullback, strong response.
After a clean pullback toward the golden EMA area, price built a small base and just printed a bullish engulfing candle.
Tech has been under pressure, but NIQ is showing some resilience.
Could this be an early sign of relative strength against the broader tech sector?
$SMCI — Breakout, consolidation, now the retest.
Since my Sept 18 post, price broke out of the symmetrical triangle and formed a tight consolidation near resistance.
Even with tech pulling back, SMCI is now testing its former resistance area.
Can the old ceiling turn into a new floor, or will the bears take control?
$SMCI is dancing with the EMAs again.
After a sharp recovery, price has been bouncing above the rising EMAs while squeezing into a triangle.
Now it’s pushing toward the upper trendline.
Can the bulls break this little dance?
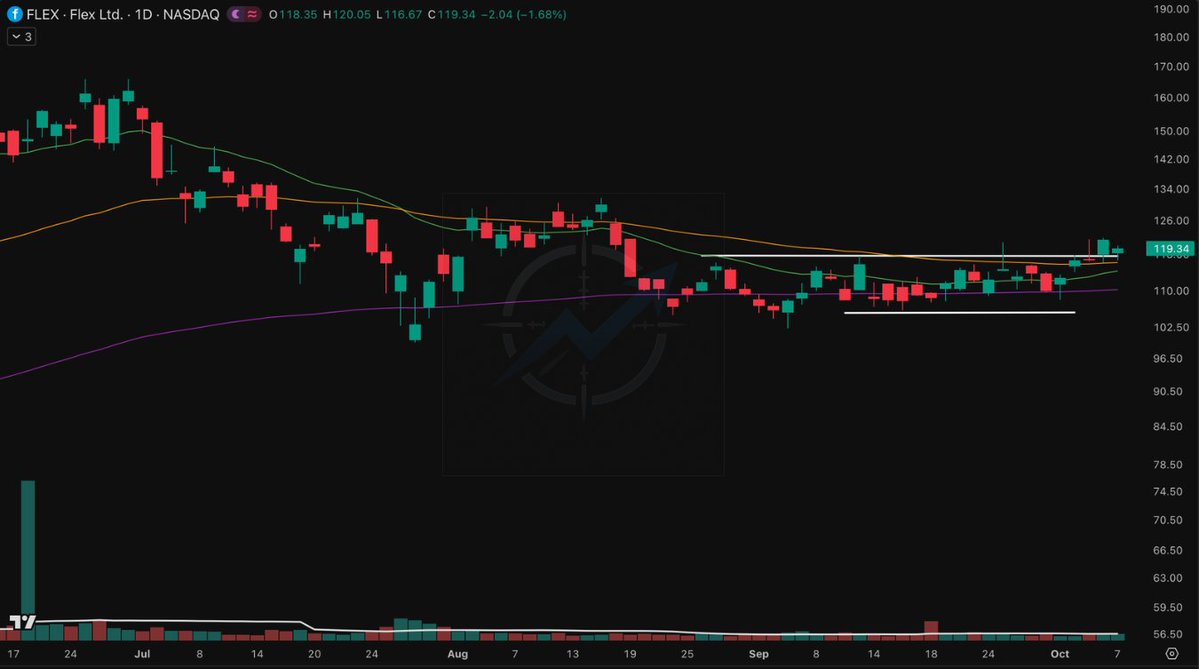
$FLEX — Still stuck in the box, but getting interesting.
Following up on my previous post, this base has been stretching out for weeks. Support around $105 and resistance near $118 are pretty well defined now.
Price keeps holding the lower range, and it's back dancing just beneath resistance.
I'm watching for a clean breakout. No rush.
Anyone else keeping $FLEX on their radar?
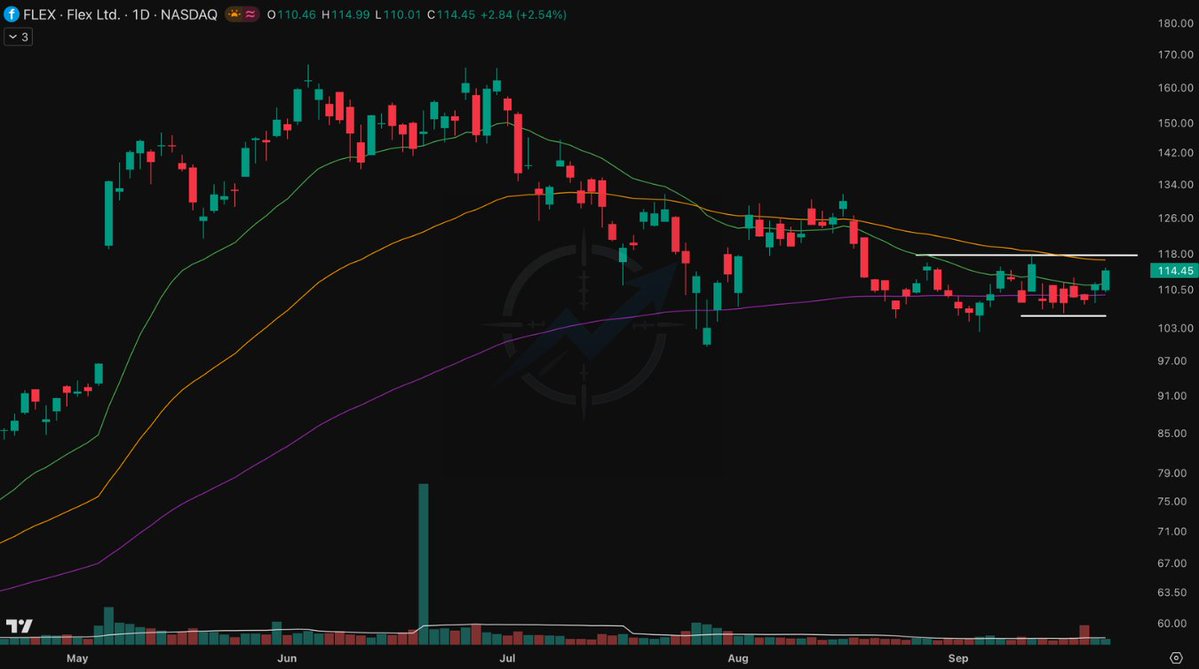
$FLEX went from rally mode to squeeze mode.
After the big run, price pulled back toward the major EMA and has now started compressing into a pretty tight range.
The first real test is sitting right overhead around $117–118.
Can $FLEX punch through that resistance and flip the trend back up?
$NTRS — Looks like I nailed the exit. But did I really?
Looking at the chart now, TS#4 got me out right before the trend fell apart. Looks pretty smart, right?
But when my stop was hit, I had no idea whether it was a fakeout or the start of a bigger breakdown.
And if price had rallied again? Fine. I'd wait for a fresh structure.
That's the lesson: I don't need to be right about what happens next. I just need to follow my rules.
@OptionKing33996 Love how $PLTR is getting tighter right under that old resistance. Buyers aren't backing off much. Now let's see if $195 finally gives.
$SNDK — Breakout cooled off, but buyers aren't done fighting yet.
Following up on my previous post, price has pulled back toward the rising support of its ascending triangle structure, right around the golden EMA area.
Now we're seeing a bounce attempt. If this support holds, it could turn into another higher low.
Anyone else betting this becomes the next higher low?
$SNDK — Something changed on September 8. We flagged it.
Bullish divergence. A bounce off the long-term EMA. Then higher lows started stacking up beneath resistance.
Fast forward to today, and price has finally broken through.
The early clues were there. Price just needed to confirm.
$COHR — Higher highs, higher lows, but resistance is still putting up a fight.
A large symmetrical triangle is taking shape, with descending resistance and rising support squeezing price into a tighter range.
Inside that structure, the recent price action is showing higher highs and higher lows. Buyers are stepping up.
Now price is testing the upper trendline around $340.
I'd rather see some tight consolidation here before the next move. No need to chase.
Would you take the breakout here, or wait for a tighter base?
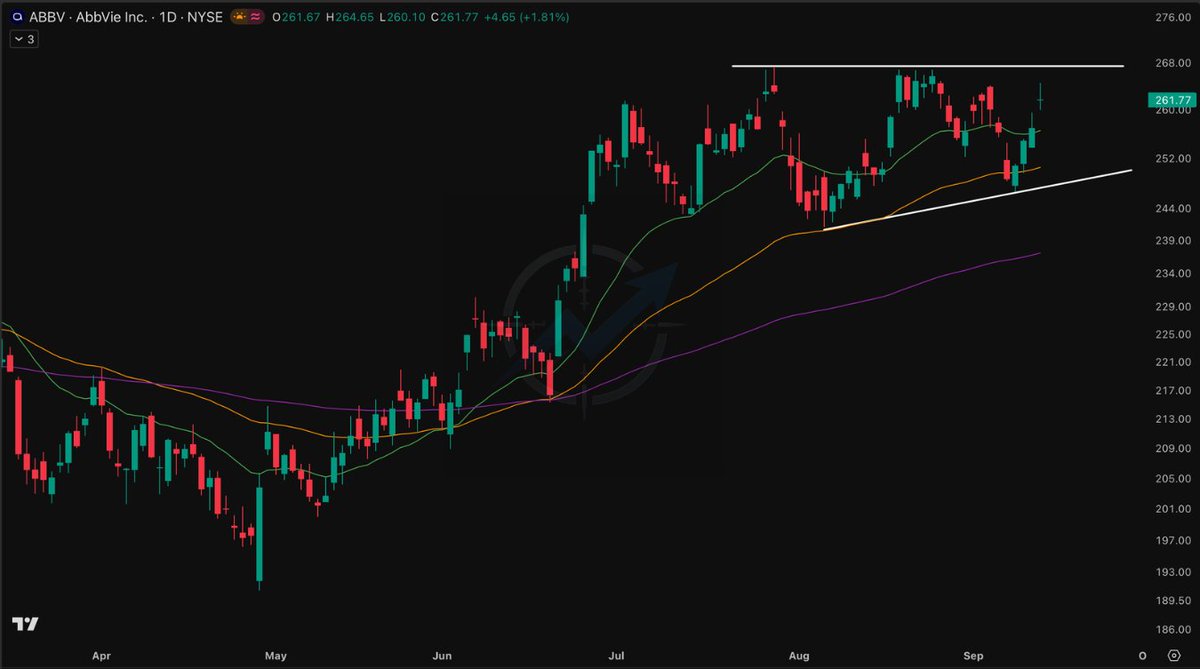
$ABBV — Kept knocking on resistance. Looks like buyers finally won.
When I first shared this, higher lows were squeezing price into resistance, forming an ascending triangle.
Then came a tight base right around that ceiling, with the rising EMA holding underneath.
Now price has finally broken out.
Anyone already holding $ABBV, or still waiting for a pullback?
$PBR — this is why I keep the downside controlled and let the upside surprise me.
Since my last update, PBR is now roughly +23% from entry — and today it delivered the kind of gap you can never plan for.
You never know which stock you’re holding will suddenly gap like this. I’ve caught moves like this many times, but the lesson is always the same: manage the risk first, then let price decide how far the winner can run.
The downside is mine to control. The upside? I just follow it.
How many traders cut their winners before they ever get the chance to catch a gap like this?
$PBR — still holding.
The breakout worked, price kept trending, and now I’ve moved my trailing stop up to TS#1.
Finding the setup is one thing. Managing the winner is where the real work starts.
How long can this trend keep paying?
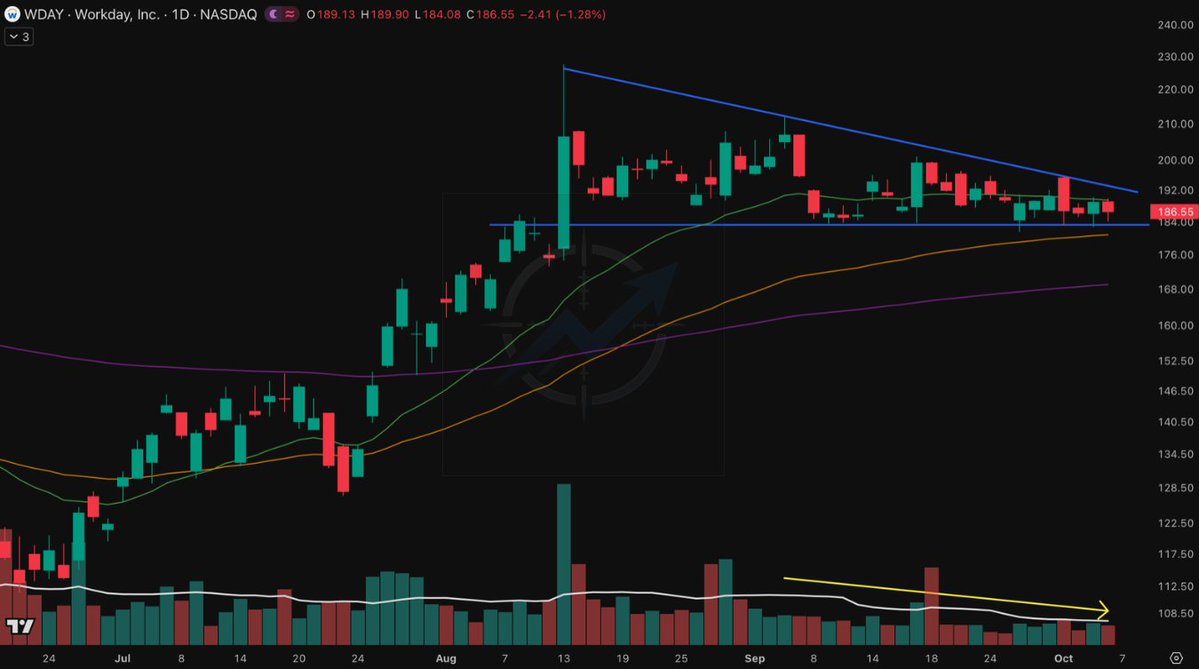
$WDAY is getting tighter by the day.
Average volume keeps fading while the structure keeps compressing — that tells me sellers aren’t getting much follow-through, and buyers still seem willing to defend the same support instead of chasing higher prices.
Now the triangle is getting pretty clean.
This is the kind of setup I’d rather wait on than force.
$WDAY looks worth keeping on the radar — do you think this compression is loading the next move?
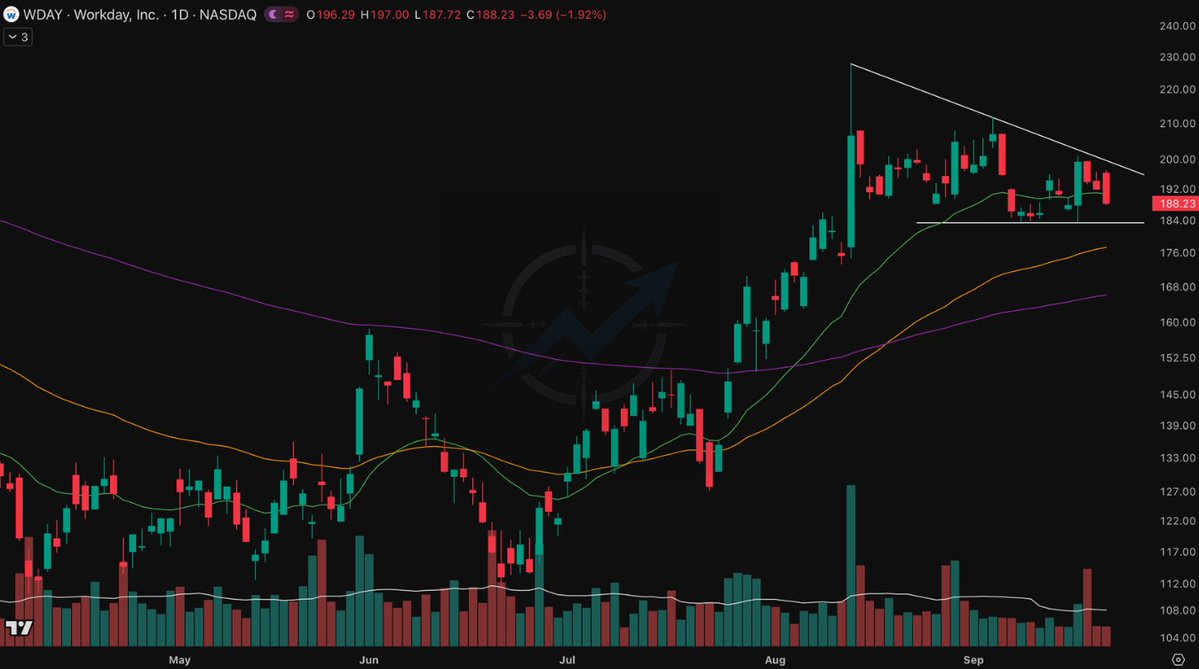
$WDAY ran hard. Now the range is getting seriously tight.
After the rally, price has been resting inside a narrowing wedge — still holding above the bigger trend support while volatility keeps compressing.
And with tech heating up again, the timing gets interesting.
Is $WDAY just reloading before the trend continues?
$SONY is getting interesting again.
Since the last follow-up, price bounced from the EMA area and the flag structure is starting to show itself.
What matters more to me is the bigger picture: the regime looks like it may be changing. All three EMAs have started turning higher.
I’d still like to see a little more consolidation around this area before getting aggressive.
If this new regime holds, we may still be early in the next trend.
$SONY is on my radar — are you watching this one too?
$SONY is back where things get interesting.
Price has pulled back into the old breakout zone and EMA support, while average volume continues to fade during the pullback.
For a swing, the risk/reward is starting to look interesting here.
Bounce from support or more downside — what do you think?
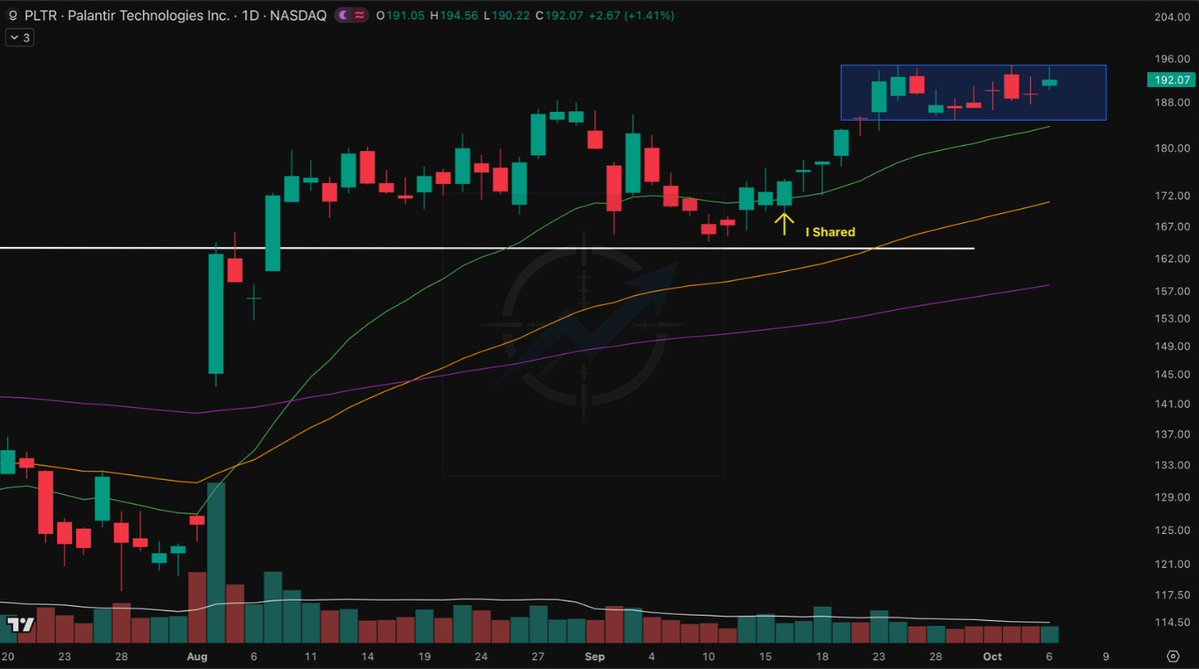
$PLTR is still acting right.
After the repost, price keeps holding above the old resistance and now it’s building a tight box instead of giving the move back.
That’s what I want to see.
From here, the risk/reward starts to get interesting again. If this box breaks higher, the swing low of the box becomes a clean trailing stop reference for anyone already in.
You already got your seat, or are you still waiting for $PLTR to fire the next breakout?
We shared $PLTR while it was doing the boring part. Now +10%.
Back on Sep 17, price was consolidating right above old resistance after it flipped into support. Volume was drying up, while the trend had time to catch up underneath.
That’s the lesson: don’t confuse “nothing happening” with “nothing setting up.”
Sometimes the quiet part is exactly where the next move is being built.
We keep tracking these structures before they get obvious.
More setups + follow-ups at Sniper Alpha Research ↓
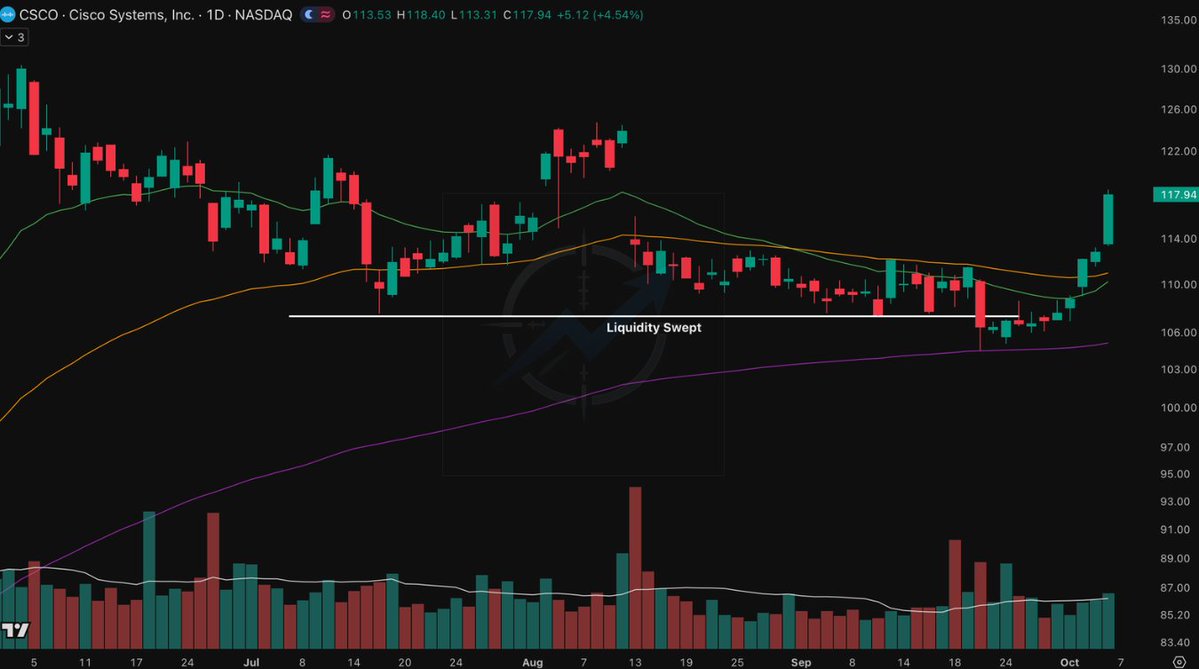
$CSCO — remember that support I was watching on Sep 21?
It broke… but instead of failing, price swept the liquidity below it, shook out the obvious stops, and snapped right back.
Now $CSCO is rallying hard and reclaiming the EMAs.
After kicking everyone off the train, does it finally take a breather and build a new base?
$CSCO — Three months of cooling down. Is tech about to wake it up?
Since its June 4 peak, price has been consolidating while average volume gradually dries up.
$XLK is now breaking out relative to $SPY, but CSCO is still sitting near support.
Will tech leadership give this sleeping giant a push, or will support give way first?
$NOW — the inverse H&S breakout I shared on Sep 16 is still holding its ground.
The old neckline resistance has flipped into support, and now price is building a fresh flag right above it.
I like this spot — the structure is resetting without giving back the breakout.
Does $NOW compress a little longer here, or is the next bounce already loading?
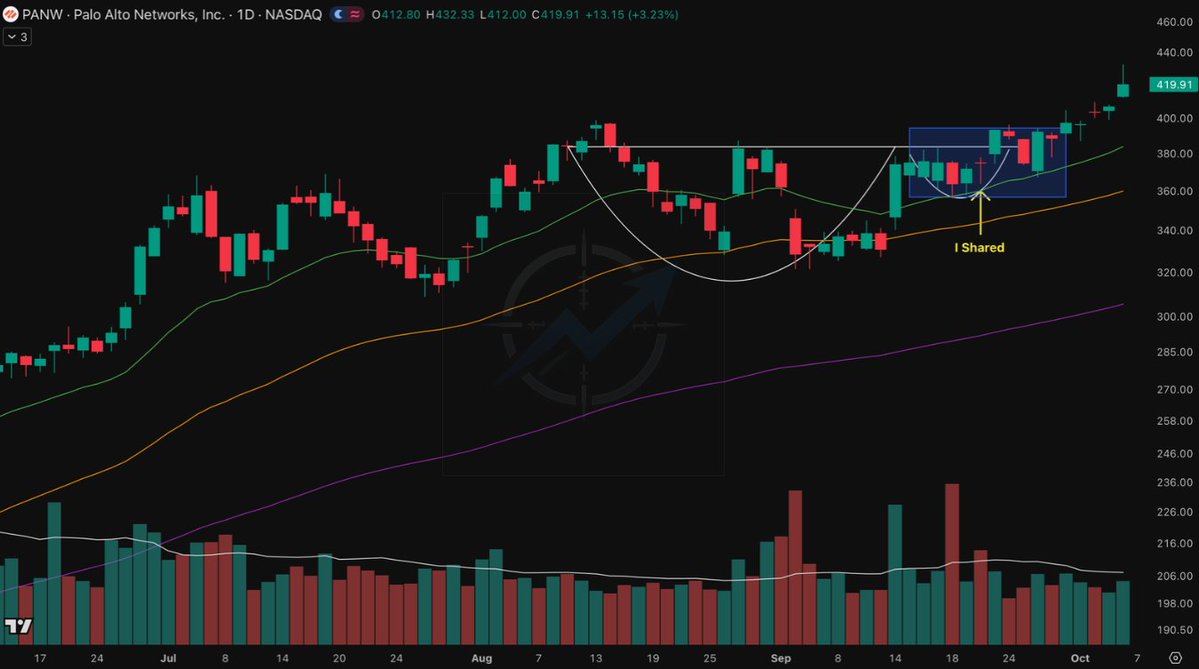
$PANW — called this setup on Sep 23. Now +12.1% since the share.
Price spent some time building a small base right at resistance instead of getting rejected.
Now the base is gone. Breakout.
The setup was there before the move — did you catch this train, or are you watching it leave the station?
$PANW is knocking on the same door again.
The cup & handle structure is pretty clear, but the handle is what gets interesting — a tiny compression forming right underneath resistance.
Very little room left for price to hide here.
Hmm… is $PANW getting ready to finally break out?
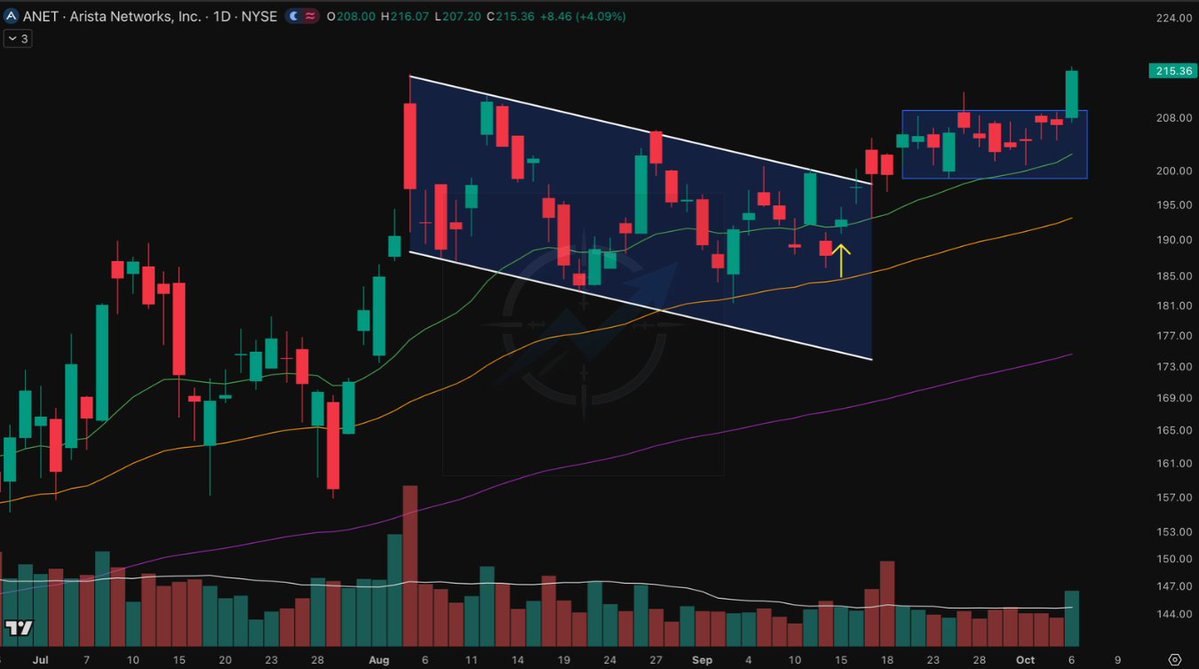
$ANET — the bull flag I shared on Sep 16 just delivered.
Now +11.7% since that post, and price has finally broken out of the new compression box.
For anyone already in, the latest swing low inside that box is now my key invalidation level. Simple structure, simple risk.
Breakout confirmed. Now the real question — you already got your position, or still watching $ANET run?
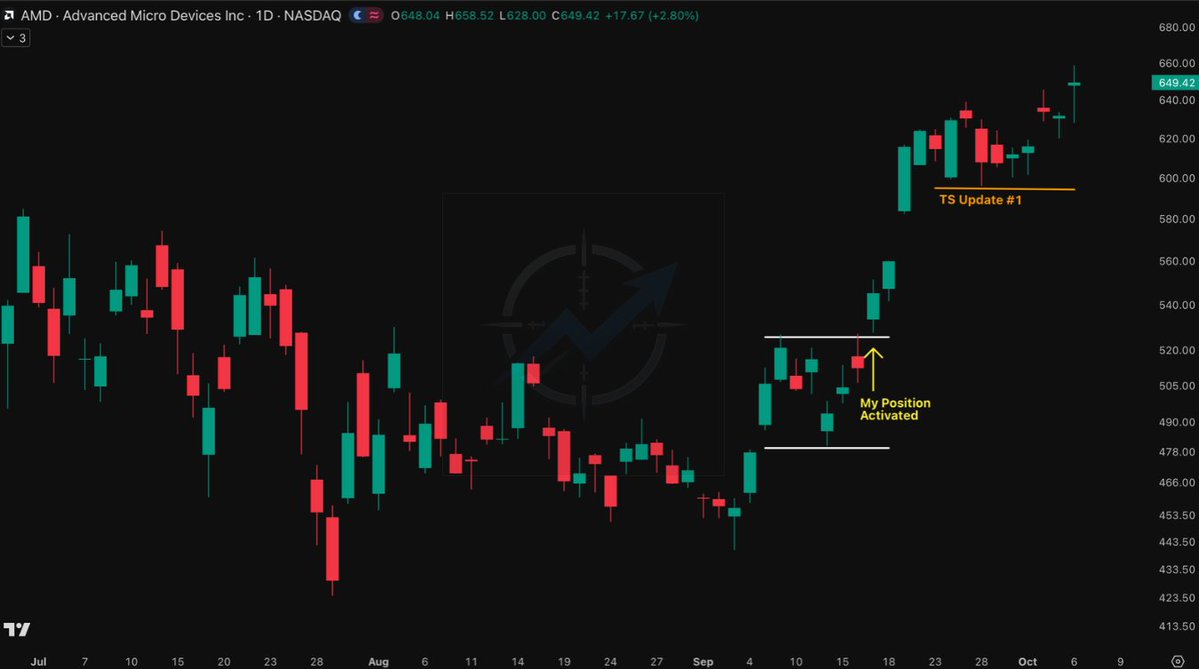
$AMD was +15.5% when I last shared the position.
Now it’s +21.7% and still running.
The new compression base has broken higher, giving me a clean structure to update my trailing stop.
TS Update #1 — protect the trade, give the trend room to work.
How far can $AMD push this next leg?
$AMD +15.5% unrealized. Still running.
Our Elite position was activated at $533, right at the breakout.
The lesson? Find your setups before the move.
Once a stock takes off, chasing makes it harder to define a clean invalidation level without stretching your risk.
Find the setup. Define the risk. Let price do its thing.
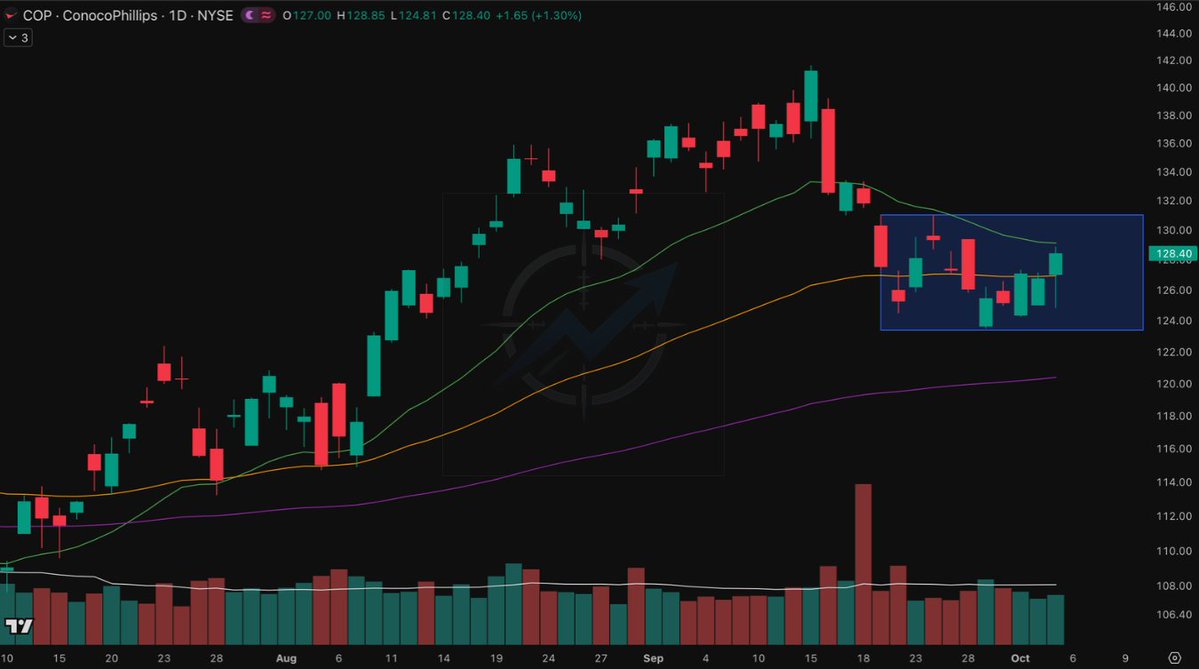
$COP — Energy Bounced. Is This One Next?
$COP pulled back into the EMA golden area, found buyers, and is now building a base around that zone.
What makes it more interesting: $XLE has already bounced from support.
The sector is reacting. $COP is trying to hold its structure.
Does $COP follow Energy’s lead and bounce from here?
$U — The Sweep Happened. Now I’m Waiting.
Follow-up from my Sep 24 post.
$U swept liquidity below the range, but the EMA golden area held. Price bounced hard from there and is now sitting right back at the mini resistance.
I like the reaction, but I’m not chasing the noise. I’d rather let things calm down and see what structure comes next.
I’m waiting here — are you waiting too, or taking the shot?
$U is getting tight right below resistance.
The pullback found support around the EMA golden area, and now price is compressing again near the highs.
Simple setup. Clear level.
Can $U finally punch through resistance?