Another power failure, IT working to restore servers, storage and network - both https://t.co/Le6H67iMCc and https://t.co/uIE7i8uU4h will be down for a while
The SolarMonitor2 Alpha website is now available at: https://t.co/TxHBBGSplz
The site is under continuous development and feedback is more than welcome.
Flare table (https://t.co/TxHBBGSplz, bottom of page) and orbit plots (https://t.co/MQIqFZuRbv) now live 🚀Issues, requests or other feedback here https://t.co/rknzEcJp5U
To achieve a higher data cadence SolarMonitor 2 relies on async processing using Celery.
Flower dash shows instrument ingest commands launching celery tasks to process each data file. Image processing/create cutouts etc performed async before saving end products to the database.
🚨 JOB Alert 🚨
3 year Post doc using deep learning on active regions and flares - https://t.co/woO1OcWrqA
1 year scholarship working on https://t.co/D66xL9KJAZ - https://t.co/s2sZBwIMdH
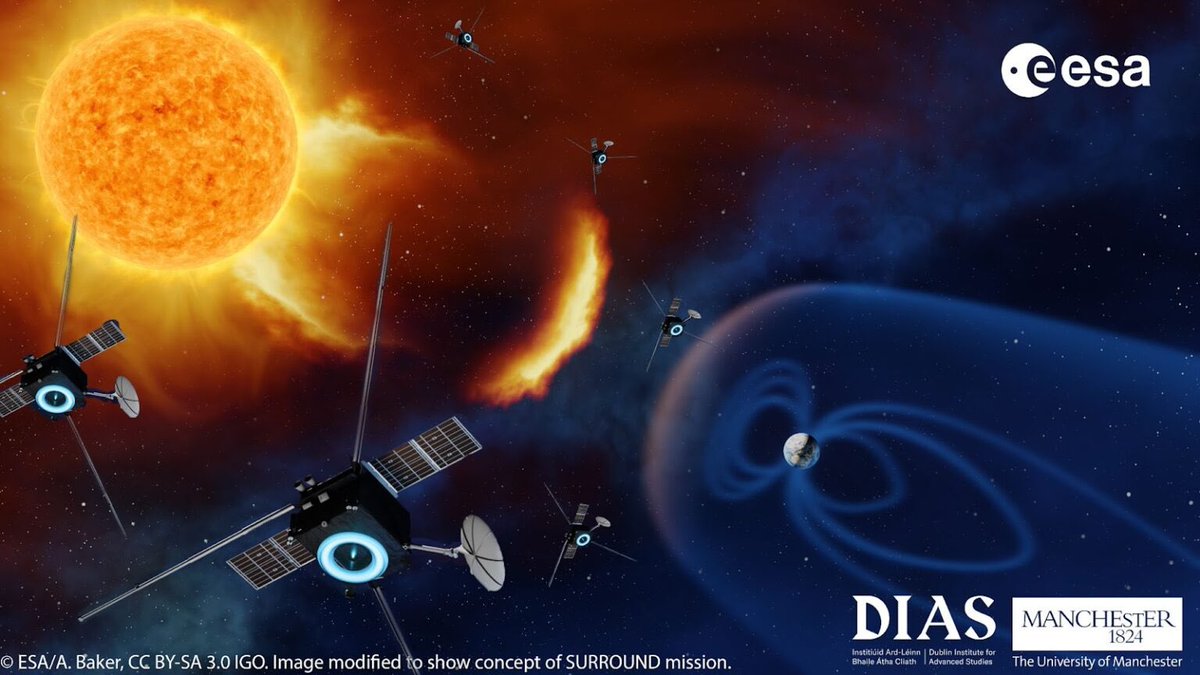
@DIAS_Dublin@DIASAstronomy@SolarMonitororg@ARCAFF_EU
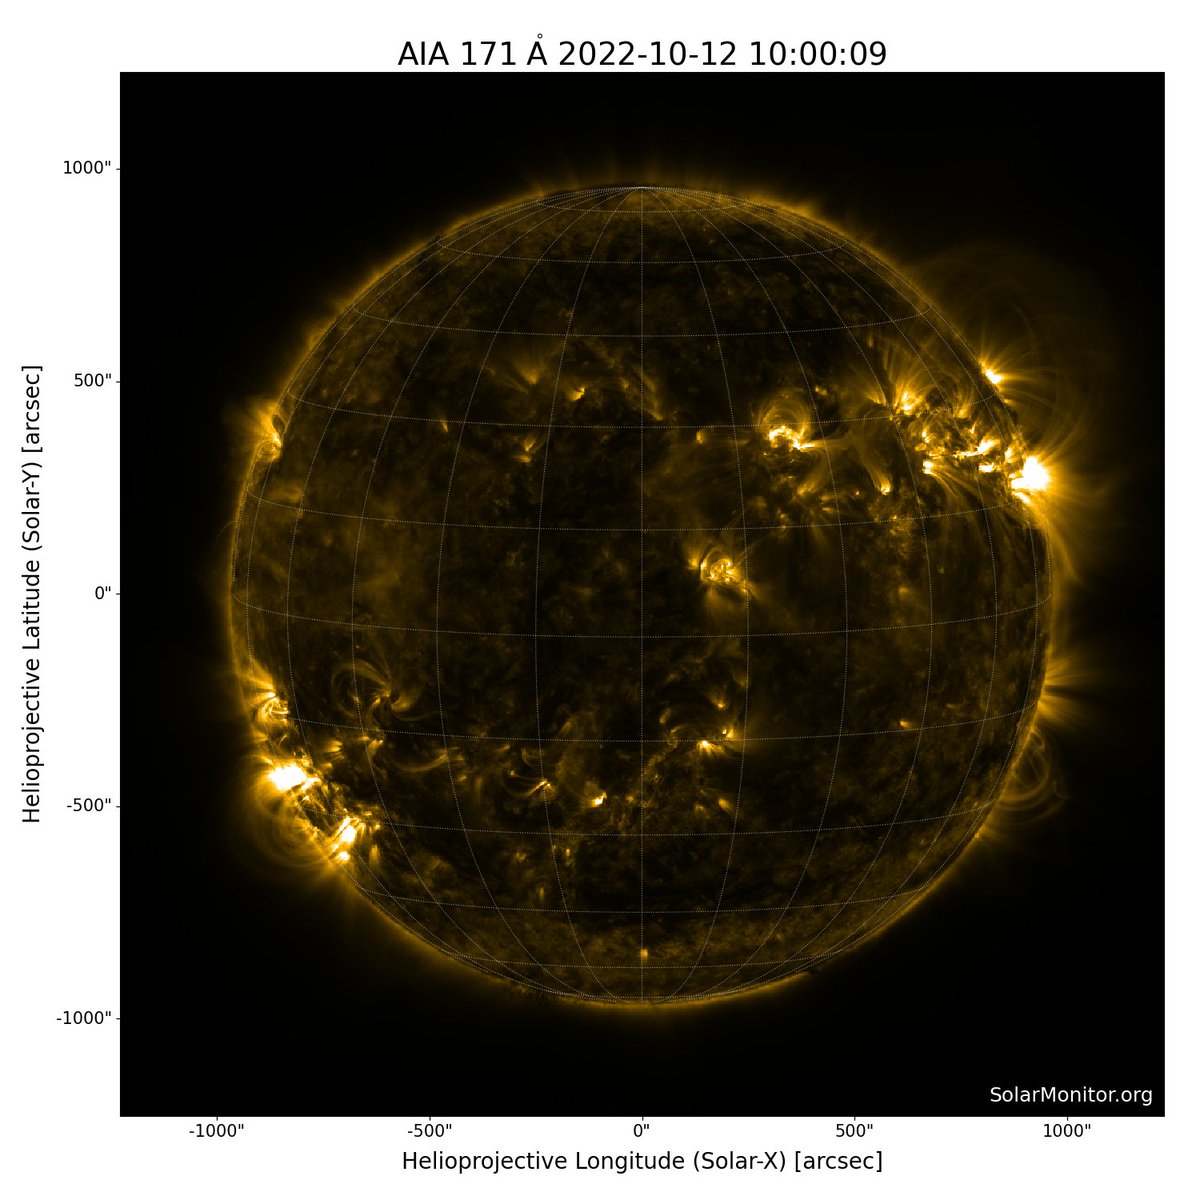
SolarMonitor 2 relies on existing community python projects. In particular @SunPyProject Map and submap are used to plot our full disk and AR cutout images.
While we move ever closer to a beta for SolarMonitor 2.0 we offer some sneak peaks at the last year+ of work.
Solarmonitor 2.0 uses a PostgreSQL database to store data products, these are served to the website via a RESTful API: