If you have a Gmail account, you need to read this.
Google's AI now scans your emails and attachments, bank statements, tax files, medical letters, all of it. It turned on by default, and there's a class-action lawsuit over how.
Here are 5 moves to shut it off, the switch is hidden in two places:
My 5 MF schemes have completed 10 years+ holding period
Around 7 stocks have completed 10 year holding..
The real flex is holding your nerves and staying put.
God has been kind !!
Neeraj Chopra is greater than any sportsperson this country has ever produced.
He chose javelin and went on to become an international star.
Cricket is played in every gulli nukkad.
Try this achievement in any other sport.
He is greater than Sachin and Virat combined.
NIFTY50 Read 🚨
Everything has happened in the past.
Don't overlook it coz the exact same pattern will play out this time as well.
Many will ignore but don't be like them if you want to build your GENERATIONAL SETUP.
DON'T MISS IT! Share it
NIFTY50 🚨
Repost for reach!🙏
Watch the video completely to see the perspective from 2027.
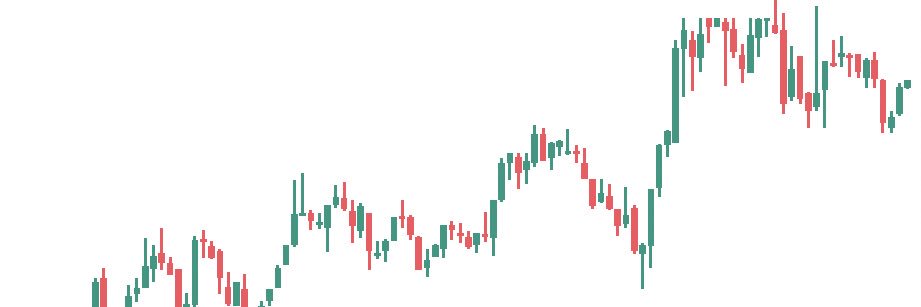
In today’s video, I took a deep look at Nifty 50 through the lens of higher timeframes — the 3M, 6M, and 12M charts. Each candle here represents significant time, so the signals are powerful and less noisy.
My main thesis is clear: We are setting up for a Triple Top formation on the 3M chart, followed by a violent downward ride. Let me walk you through what I’m seeing step by step.
3M Chart View
On the 3-month chart, we’ve already seen a green candle. The RSI, which had fallen sharply, is now trying to pull itself back up. But don’t get too excited yet — this is a higher timeframe, so moves are smoother and slower.
I’m expecting the index to form green candles ahead, but they won’t be those massive bullish ones we saw during the strong momentum phase. Instead, we’ll likely trade in a strict range, building toward a Triple Top near or slightly above the last all-time high.
The price may try to push to that previous peak (or even create a small spillover) to confuse the market. However, if the RSI shows a hidden bearish divergence and forms a lower high, it will be a strong warning. RSI denial at those levels should trigger the real downside move.
This is not about bending or curving randomly — it’s a structured formation I’m watching closely from pure price action and RSI.
6M Chart View
On the six-month chart, we’ve already formed a top, and the RSI is sitting comfortably in the momentum zone.
The upside action I’m anticipating should mostly play out within the next one year. We might see the next candle body complete somewhere around the 25,612 – 25,692 zone.
I’m looking at a four-candle base here. It generally doesn’t form a clean double top without curves — we’ve already seen one curve, and I expect another. There could be some spillover beyond the all-time high, but it won’t sustain. Everything points to major developments unfolding within 2027 itself.
If we make a higher high in this structure, it will definitely influence how I manage my portfolio (more on that in future videos).
12M Chart View
The 12-month chart is always trickier because each candle covers a full year. We may see a retrace over the next six months, forming a small top. After that, there’s potential for a move toward the red zone (downside territory).
If the bigger moves play out within 2026 itself, the next 12M candle could turn out to be super strong. But for now, I’m leaning more on the clearer signals coming from the 3M and 6M charts.
HDFC Bank 🔥🚨🫶
As mentioned now it will participate in market, watch the video for more info.
Avg Advances under Mgmt: ₹30,386 Cr (+10.8% YoY)
Period End Gross Advances: ₹30,610 Cr (+15.4% YoY)
Avg Deposits: ₹30,114 Cr (+13.3% YoY)
Period End Deposits: ₹31,705 Cr (+14.7% YoY)
CASA growth slower at +9.4% (period end).
Time deposits strong at +17.4%.
REPOST!
Balance sheet growing healthy. Results awaited.
#HDFCBANK #BankingStocks
NIFTY GIFTNIFTY
As I have mentioned before that we have gone through this scenario in the past.
We are heading towards a H&S pattern
It's going to be a fun ride because the scenario will make us generational wealth.
Repost, if you want to find out what's next
NIFTYIT Analysis
Weekly - On weekly timeframe we have seen 6 consecutive red candles, now it is time to form some green.
After a deathcross, price initially goes down to stretch the moving averages. This creates the sharpest decline in the index or stock.
After it, the price tries to recover the first fallout so right now in NIFTY IT the price will try to recover towards 31-32k, this is when another rejection will happen. This rejection is classic case of death cross where we will try to form a consolidated pattern. It is a good thing! we will see a bullish divergence on weekly where the RSI will strengthen.
Post this we see a triple top formation in IT this is when I am expecting the global meltdown.
Don't consider the timeline because everything will happen by 2027
So short term you are in for good returns in IT but I will be selling it with nominal return.
Want to understand where Gold is headed?
Don’t start with Gold.
Start with Bonds.
Sounds strange?
No, its not -
👉If one Want to understand asset prices, first understand the price of money. The bond market sets that price.
Interest rates influence the US Dollar.
And since Gold is priced in Dollars, the Dollar has a big influence on Gold prices.
That’s exactly what’s happening currently!
US 2-year bond yields have risen.
Higher yields make Dollar assets more attractive.
The Dollar strengthens.
Gold comes under pressure.
There’s another reason.
Gold delivered exceptional returns over the last few years and attracted a lot of speculative money.
Speculators don’t invest for the long term.
They react to changes in bond yields, interest rate expectations and the Dollar.
👉When these move against them, they sell.
Prices correct. Headlines change.
But the long-term story doesn’t.
Why?
Find out yourself:
👉Have central banks stopped buying Gold?
👉Has global debt reduced?
👉Has geopolitical uncertainty disappeared?
The answer is NO.
The long-term drivers remain intact.
Only the short-term drivers have changed.
Remember:
Bonds drive interest rates.
Interest rates drive currencies.
Currencies drive asset prices.
If you understand bonds, you will understand why markets move.
👉I will soon be releasing a detailed video explaining this entire chain,from Bonds to the Dollar to Gold in the simplest possible way.
Stay tuned.🙏
#investing #gold
My view on Short term Trading :
In short-term trading, you can’t force the outcome.
The market moves fast and doesn’t owe you anything.
The only two things you can control are: • Your process • Your risk on every trade
Master these two and stay consistent.
@plutusadvisors@preetiplutus