I wanted to share a few thoughts on liquidity from last week’s MIT report that dropped on @RealVision. Hope it’s helpful…
Regarding liquidity, we’ve seen a small tick lower in our GMI Total Liquidity Index this month, but that’s almost entirely being driven by the rebuild of the TGA and the government shutdown, which temporarily halted the drain.
However, this too shall pass...
Remember, weak lagging employment data is what keeps the Fed engaged, or in GMI lingo, MOAR COWBELL…
Lower rates then feed through to more rate-sensitive and leading areas of the economy like housing, and this drives the business cycle higher… it’s a recursive feedback loop.
Once this shutdown ends, the liquidity taps will open again in a big way.
We’ll see TGA spend, rate cuts, the end of QT, probably a repo tweak to ease tightness, talk of eSLR relief in January, and a pivot back to an "ample reserves" regime as QT winds down.
That’s a wall of liquidity coming, and that’s just the US…
It also feels to us that the lead time of financial conditions, looking at this chart (chart 1), may have actually increased a little since the start of 2023 versus our GMI Total Liquidity Index.
I’m not going to adjust it to overfit the chart, but it’s almost a perfect fit if I adjust the lead to six months for this period.
Either way, I believe we’re going higher.
As a reminder, this is how the phasing works between financial conditions, liquidity, and the ISM (chart 2):
GMI Financial Conditions Index > GMI Total Liquidity Index > ISM
I also think the view that the liquidity cycle will peak early next year isn’t going to be right.
Feels too early for that. Let me explain…
You see, The Everything Code’s debt refinancing cycle plays out in two major phases.
Phase one is where rates need to come down first.
In China, that’s largely happened over the past two years as the economy struggled, with 10-year yields falling from around 3% at the start of 2023 to 1.6% by early this year.
I pushed back pretty hard at the time against the consensus view that this collapse in rates was bearish. Instead, I argued it was a massive easing of financial conditions coming from the East.
Now that’s happened, phase two of The Everything Code can play out.
Debts can be rolled at more sustainable levels, and with the dollar now weaker, the PBoC can deploy its balance sheet, which this month hit a record high and could reach around $8 trillion by the end of 2026 (chart 3).
That, in my view, would likely mark the peak of the liquidity cycle, with China playing a major role.
So again, this all suggests to me that liquidity is heading higher in 2026...
It’s also worth remembering that back in 2017, the Fed was hiking rates and liquidity injections were basically flat.
The real liquidity came from the PBoC and, to a lesser extent, the ECB and BoJ.
Yet despite the Fed being sidelined, Bitcoin and other risk assets ripped higher.
Raoul and I have talked about this a lot…
Everyone is too focused on the US and what the Fed is doing. What really matters is that our GMI Total Liquidity Index continues to trend higher, because that captures all of it.
Additionally, our GMI Global Excess Liquidity Composite measures how much liquidity exists in the system beyond what’s being consumed by nominal GDP.
This “excess liquidity” can be, and always is, financialized...
If you look at the chart, since the mid-1980s, equity valuations have tracked almost perfectly, roughly six months behind moves in excess liquidity (chart 4).
So this still points to further equity re-rating ahead...
What’s the bottom line?
We’re still bullish. The delay in the TGA drain and the Trump tariff scare on the 10th have been painful, but ultimately, they’re just noise.
We believe a more dovish Fed, rising PBoC liquidity, and strong Q4 seasonals are all lining up to push this market higher into year-end.
At the end of the day, it always comes back to liquidity, and we still see liquidity rising...
I seriously cannot believe people aren’t buying as much Bitcoin as possible at $67,000.
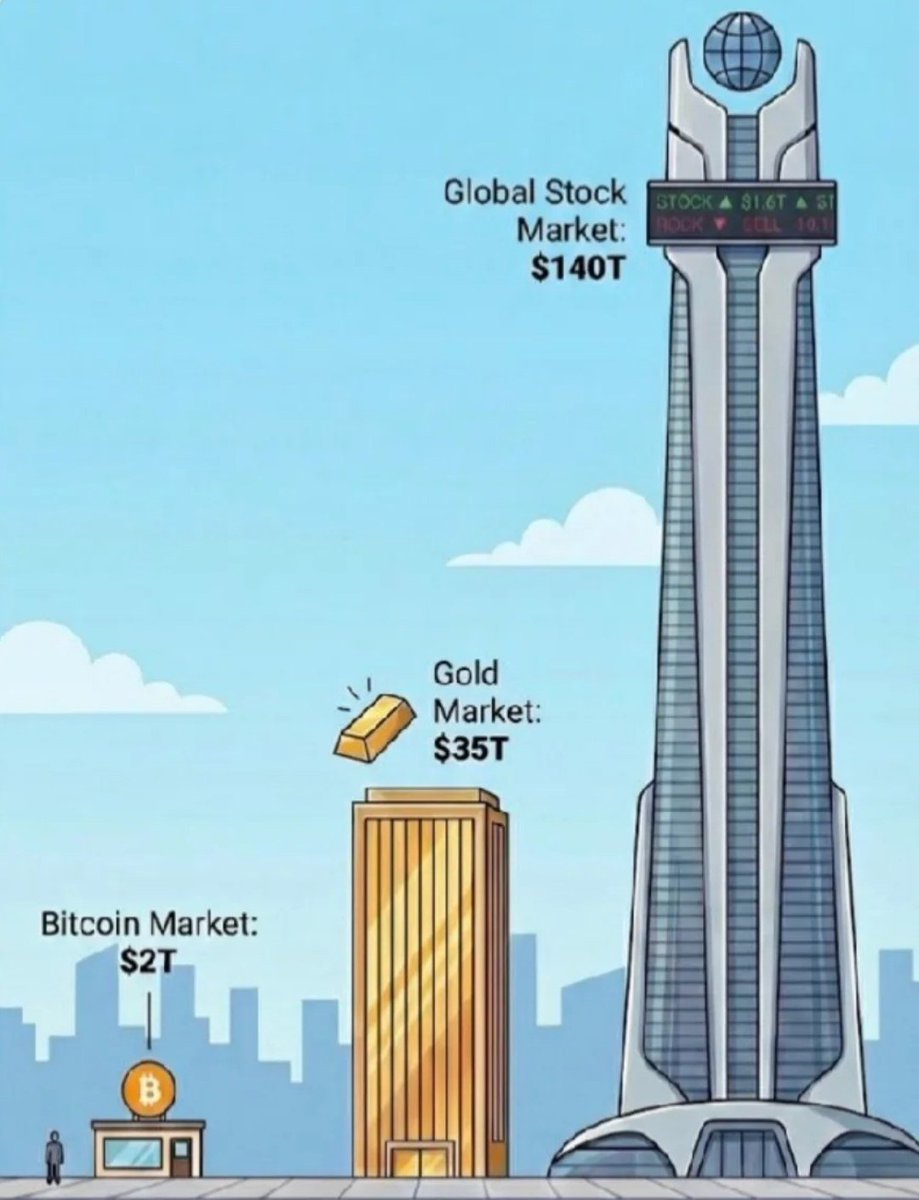
How much lower do you think it can go? Fair value vs gold is already over $180,000 — we’ve never been so undervalued compared to precious metals.
Saylor knows it more than anyone. Patience.
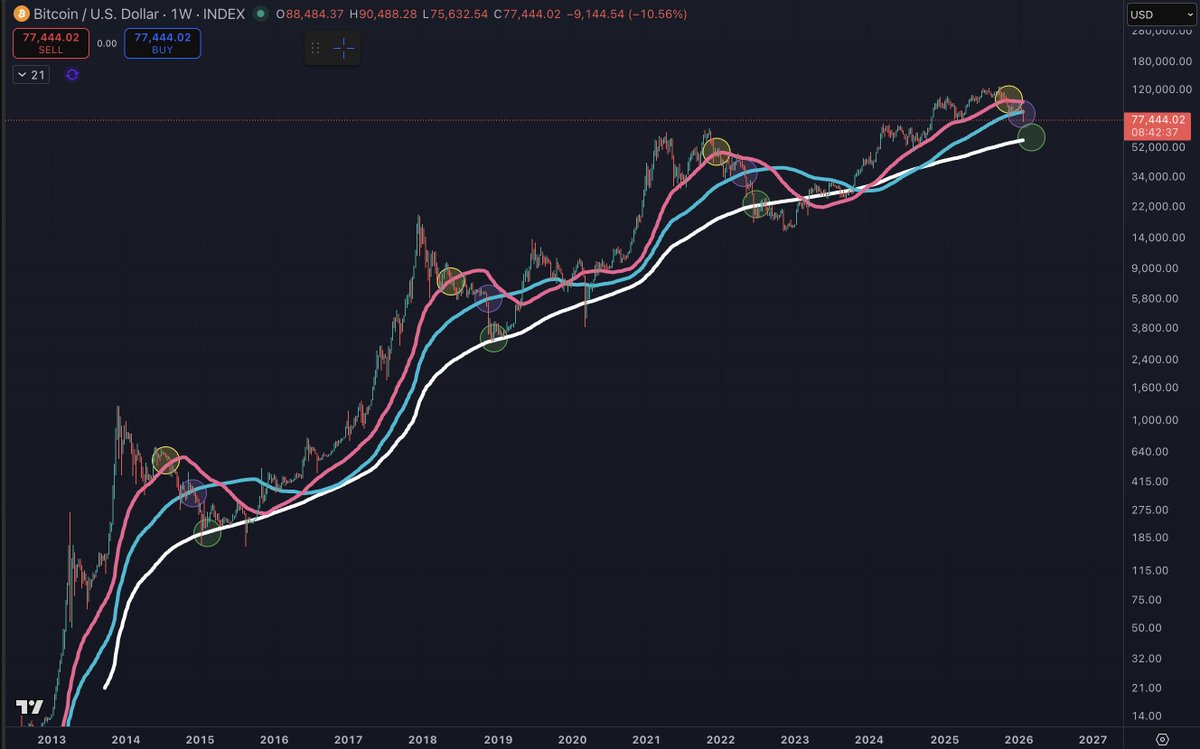
New pattern has flashed on Blackrock IGV. A double bottom with target 95 - with Bitcoins correlation at 0.92 that puts Bitcoin at a double bottom to $84k. Lets watch.
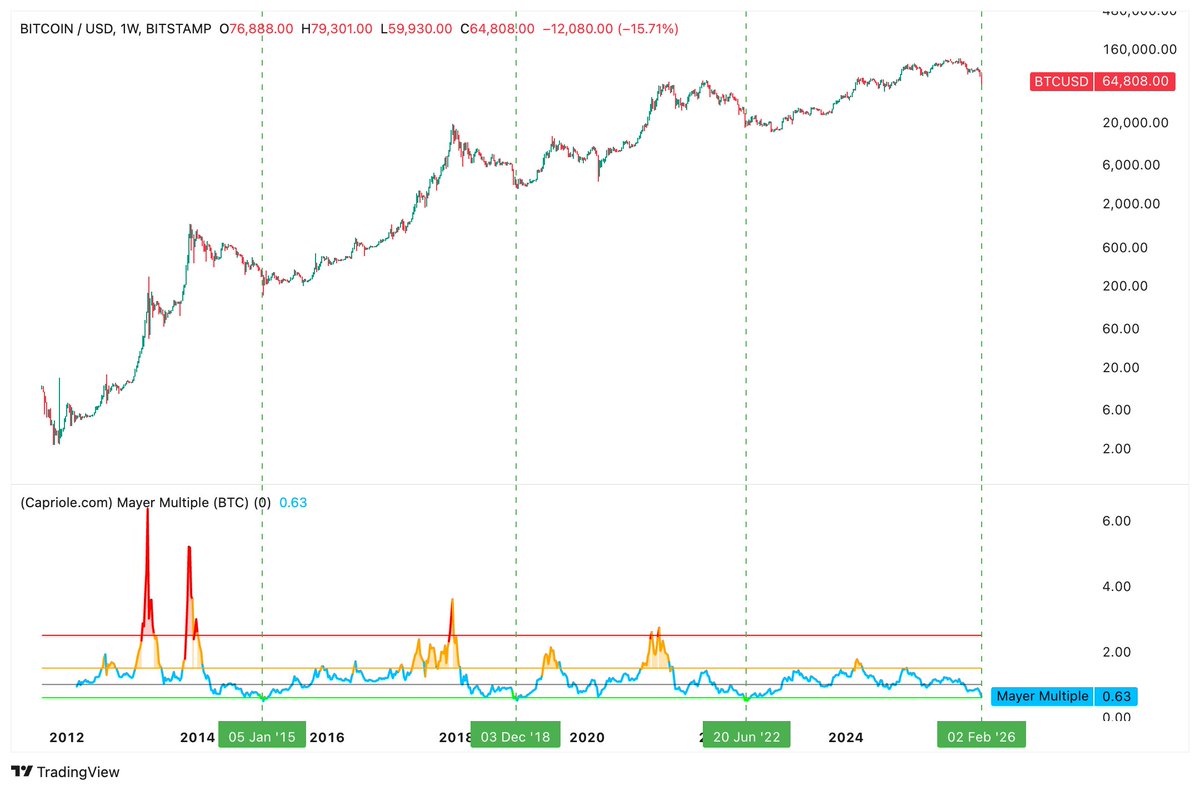
Incredibly rare and bullish Bitcoin signal is firing. Mayer Multiple, perhaps the oldest Bitcoin model. It rarely hits 0.6x. Can price go lower? yes, but this is historically one of the best buy signals in Bitcoin history.
Update: It matters when Bitcoins price floor falls.
We are now trading below Production Cost ($65K) but Elec cost has fallen to $52K. It's starting to get juicy.
Bu platform her ne kadar dünyadan her türlü habere en hızlı ulaştığımız kaynak olsa da bi o kadarda iğrenç bi yer çünkü etkileşim kasmak için ai yardımı ile götten sallama şeyler yapıp bilgi kirliliği mi desen, bu iğrenç olayı siyasete bağlayan, futbol takımına bağlayan mı desen. Nereye doğru gidiyoruz daha neler göreceğiz hiç bi fikrim yok. Allah sonumuz hayır etsin ne diyim