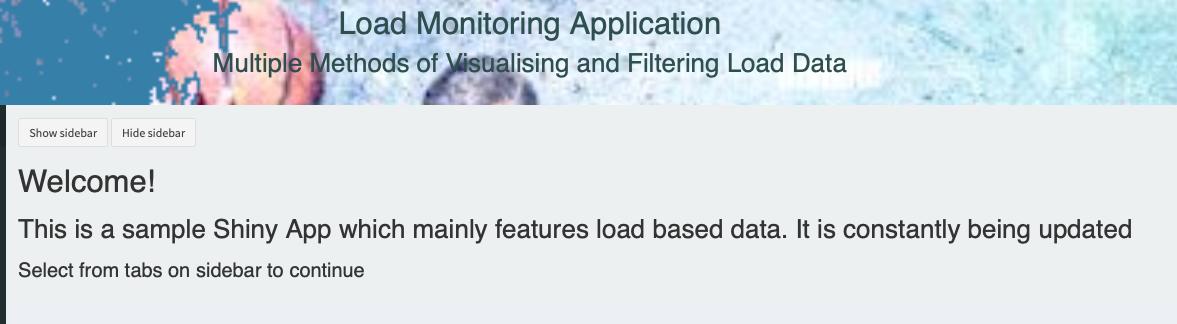
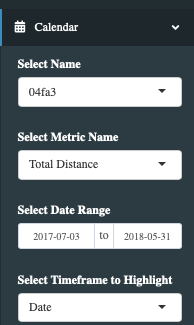
New addition to the site, embedded shiny app (under development) showing some of the topics covered throughout the blog https://t.co/21IzZHUlt0,
App itself can be viewed here: https://t.co/isAZEyPtvN
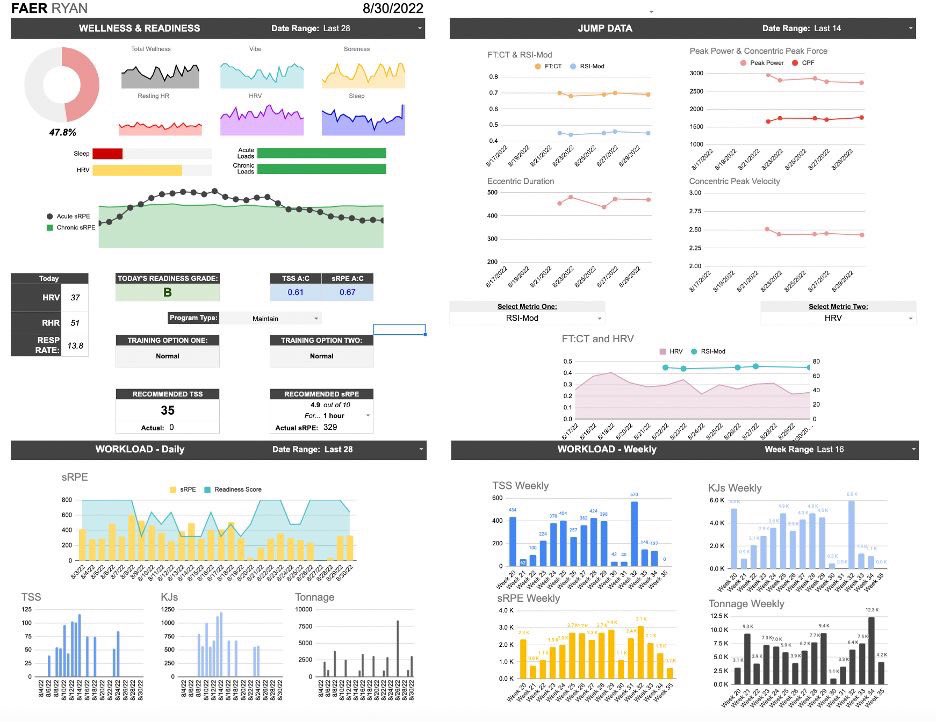
Let's make a deal:
I will share the link to my own personal Wellness and Workload dashboard on Google Sheets…
If you promise not to judge the chaos behind the curtain! 🤜 🤛
🔗 https://t.co/hIGfbbW8cP
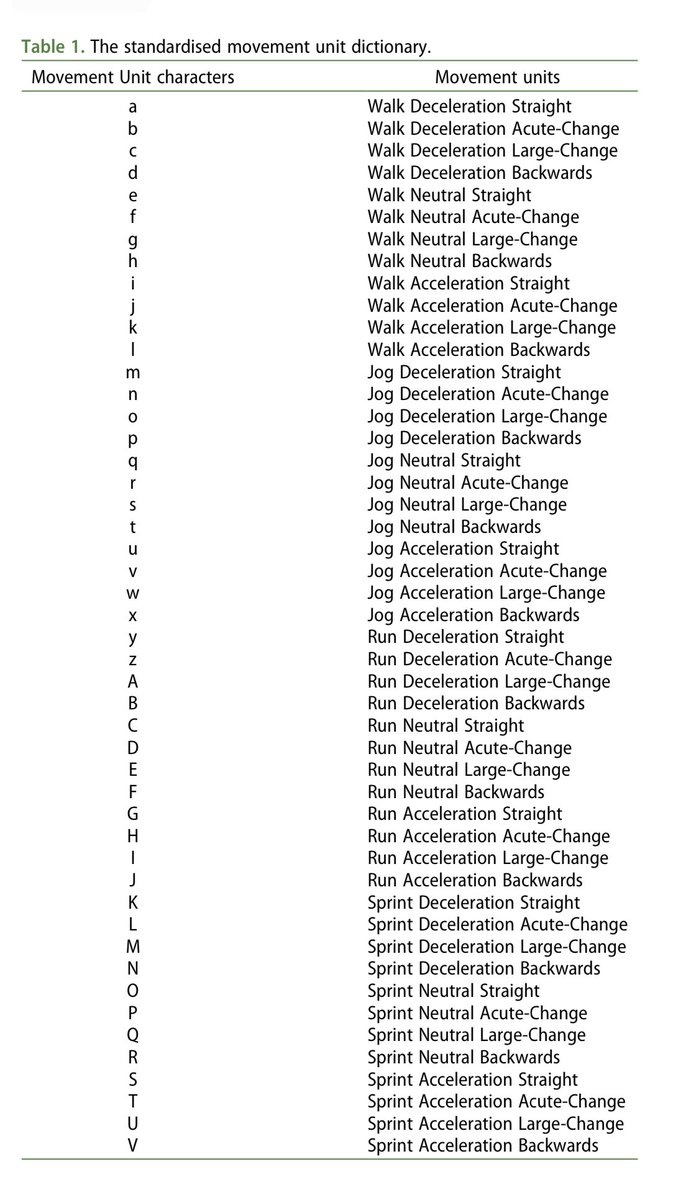
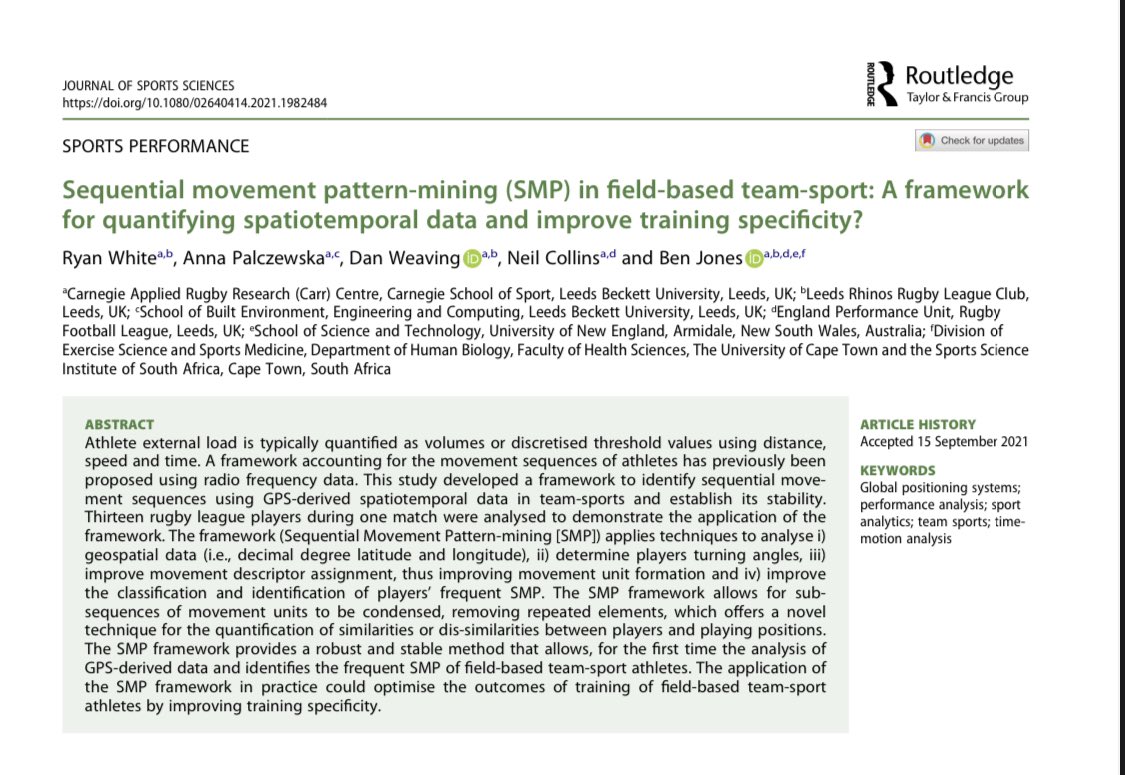
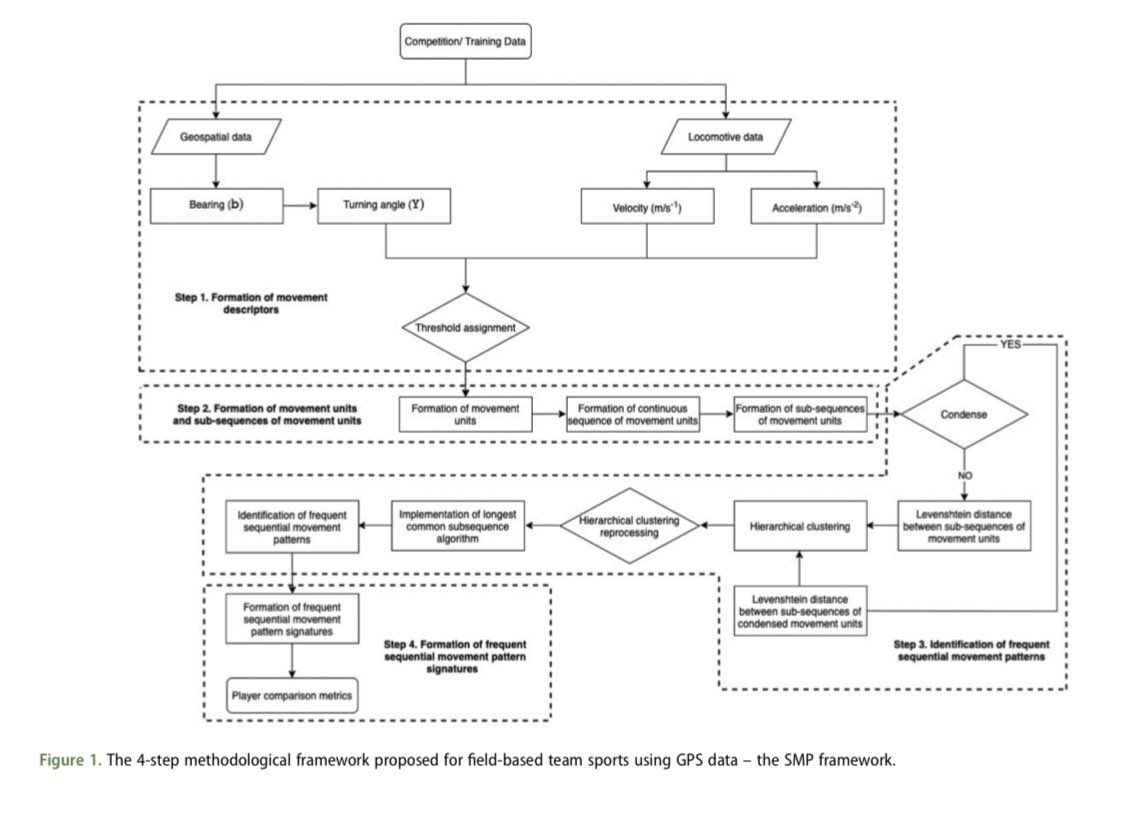
A framework to identify Sequential Movement Patterns (SMP) in team sports from GPS data, available in @JSportsSci by @RCWhite93
https://t.co/k7aw2A70pw
Helpful to identify players movement patterns, evaluate training specificity during return to play & training drills.
How to Build an Athlete Monitoring System with Free Google Products
Forgot this existed for a minute, but just received a bunch of notes from people describing how this course has positively impacted their practice. Cool to see, and very humbling 🙏
👉https://t.co/RNtP0xV2TN
Delighted to get this one over the line @IJSPPjournal@Human_Kinetics
Findings suggest;
💪🏻 Importance of individual characteristics for higher playing levels
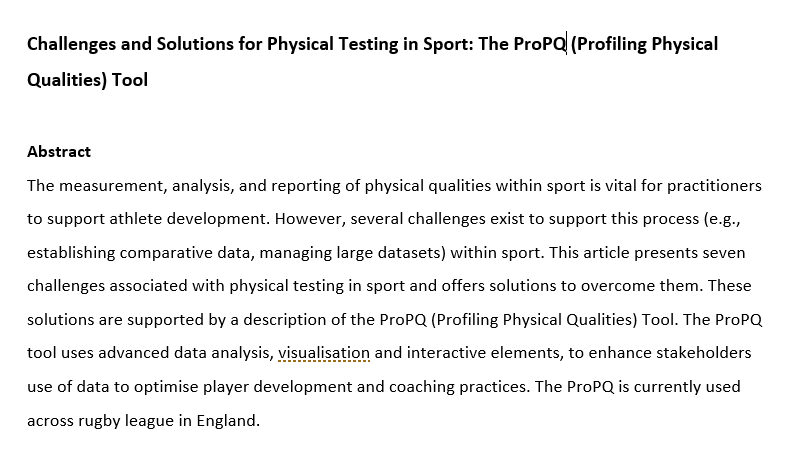
🔍 Need to assess multiple physical qualities to provide overview of physical performance https://t.co/kGFV7cGn1M
We have recently been learning all things Shiny, in our (new) sports analytics course @victoriauninews. The Shiny #RStats package allows you to build interactive dashboards, apps & visualisations.
A (very basic) sport example: https://t.co/npzfvSZzXZ
Code: https://t.co/JEakdlUcN7
Might not be feasible & not perfect, but everyone needs to understand the complexity around player readiness and the multitude of questions we need to ask, before an athlete trains. That is before we question the validity and reliability of wellness data #complex#IrishSC
Been trying to figure out how to estimate VO2 max using GPS data only
No biometric data
Just GPS data
Preliminary results looking pretty good. A few tweaks left...
After some recent convos with @aaronzpearson and his stellar work re: fatigue from wearable data, I dusted off some old code and ideas.
What I tried to do was identify "workload windows" where a player could maximize their high intensity output in relation to workload.
Going to partake in the #66DaysOfData by highlighting some of our student-athletes and technology they use to improve performance & remain resilient!
I will also highlight projects our interns & myself work on. Will also highlight new topics or skill sets!
#BlueHens 💪🤓📊📈
This may not be news to people but it was to me!
If you are ever doing a systematic review and data is presented as figures instead of tables with raw data, you can use https://t.co/fvvecSIH9N to extract the data really easily.
#systematicreview#rugbyscience#injuryprevention