I will say that you have single-handedly forced me to look at markets in a completely different way. The trip so far has been eye opening. I cant wait to start the deep dive. Oh and if you signed up and havent heard back, just be patient. I had my order in 3 minutes past opening and I just got mine. Patience :)
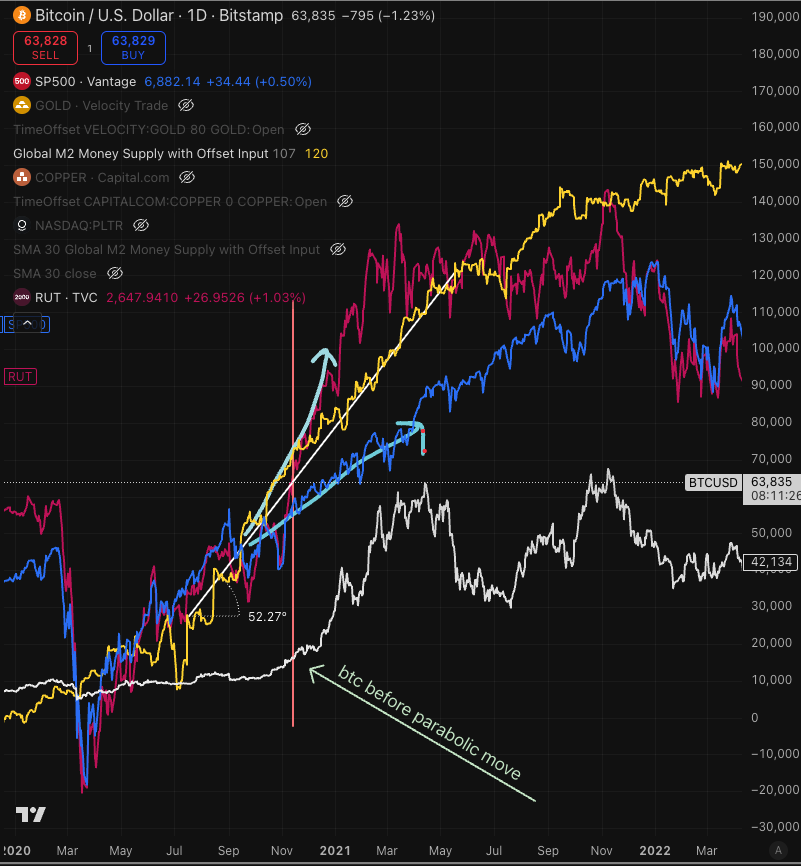
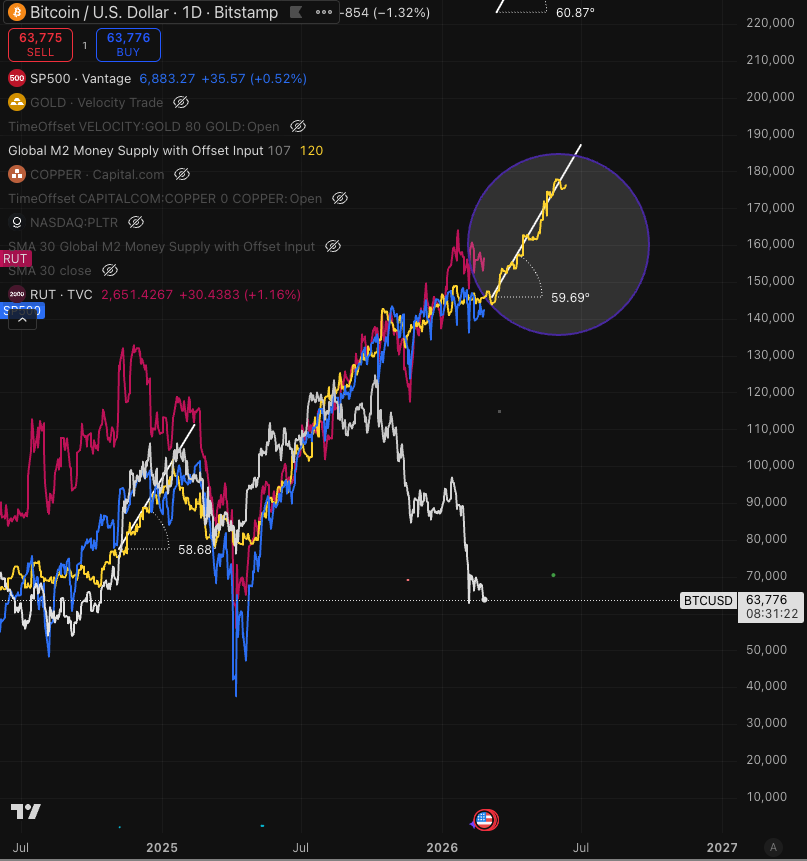
My M2 model shows that in the parabolic run of 2021, BTC was highly suppressed like it is now. The Russell (red) diverges above M2 (yellow) and the SP500 dives below it (hand drawn blue arrows) . Right around that bifurcation (vertical pink line), BTC starts catching up. I am seeing the same pattern forming today. I have measured the angle (or steepness) of M2 coming onto the market at about 52 degrees back in 2021. Starting the first week of March, the M2 about to hit the market has a steepness angle of nearly 60% (the steeper the angle the more liquidity entering in a shorter time span). This is one of the steepest increases i have seen. We will definitely see a big move in assets starting March. Whether that liquidity goes to BTC remains to be seen.
Think of M2 like the ocean surface and assets like boats. Boats don't "decouple" from the ocean surface, they simply rise or fall relative to the surface from external forces.