Want to see how yesterday's election went in your precinct?
Our elections map has been updated with the 2026 general election for every race in Arizona.
Updated regularly as new drops come in.
https://t.co/yyoWfMKGUk
The numbers we posted are the official turnout put numbers by registration.
Just because you are registered for one party, doesn’t necessarily mean you have to vote for said party.
The difference in results and registration numbers you point out seem to point towards voters voting against the party they are registered as.
LAST UPDATE: Maricopa County general - Election Day ballots (11/3):
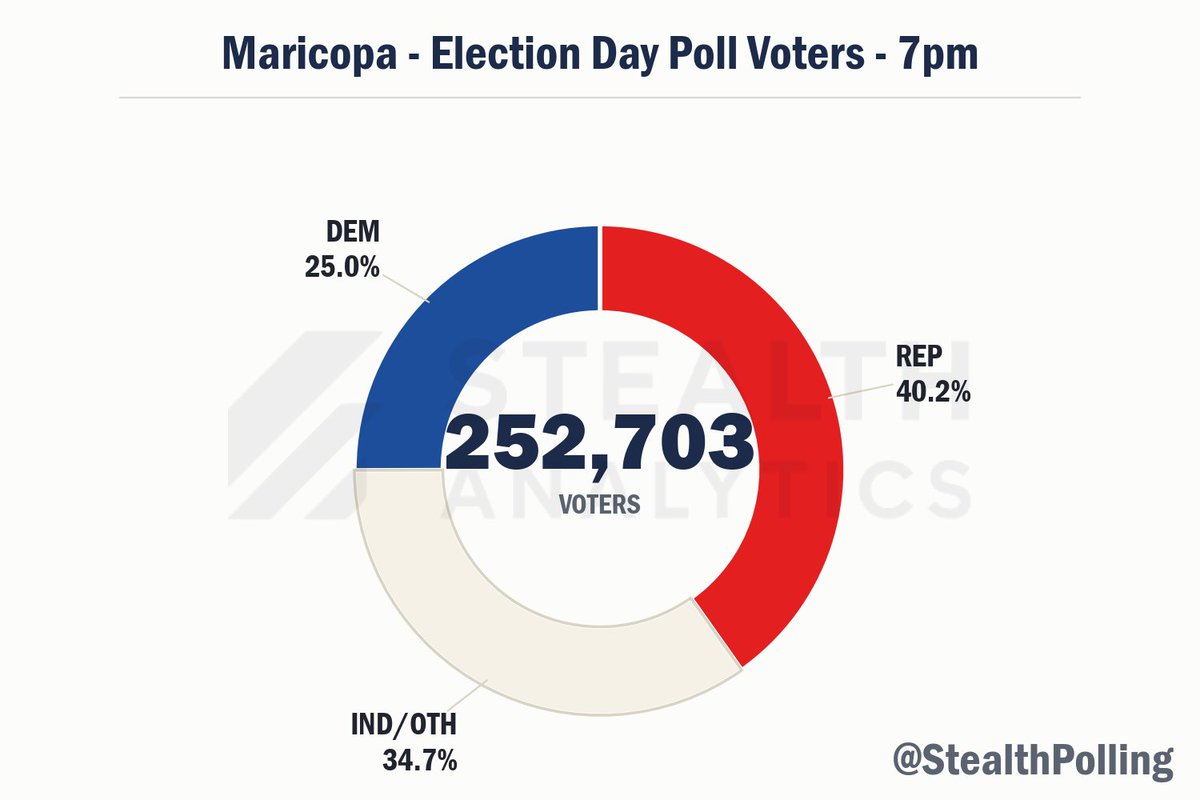
7 PM update.
252,703 at 254 vote centers. Includes early ballots, not just walk-ins.
🔴 Reps 101,616 (40.2%)
🔵 Dems 63,288 (25.0%)
⚪ Ind/Other 87,799 (34.7%)
Reps lead by 38,328 ballots (+15.2 pp) of 252,703 in.
Maricopa County general - Election Day ballots (11/3):
6 PM update.
229,128 at 254 vote centers. Includes early ballots, not just walk-ins.
🔴 Reps 94,030 (41.0%)
🔵 Dems 56,604 (24.7%)
⚪ Ind/Other 78,494 (34.3%)
Reps lead by 37,426 ballots (+16.3 pp) of 229,128 in.
Maricopa County general - Election Day ballots (11/3):
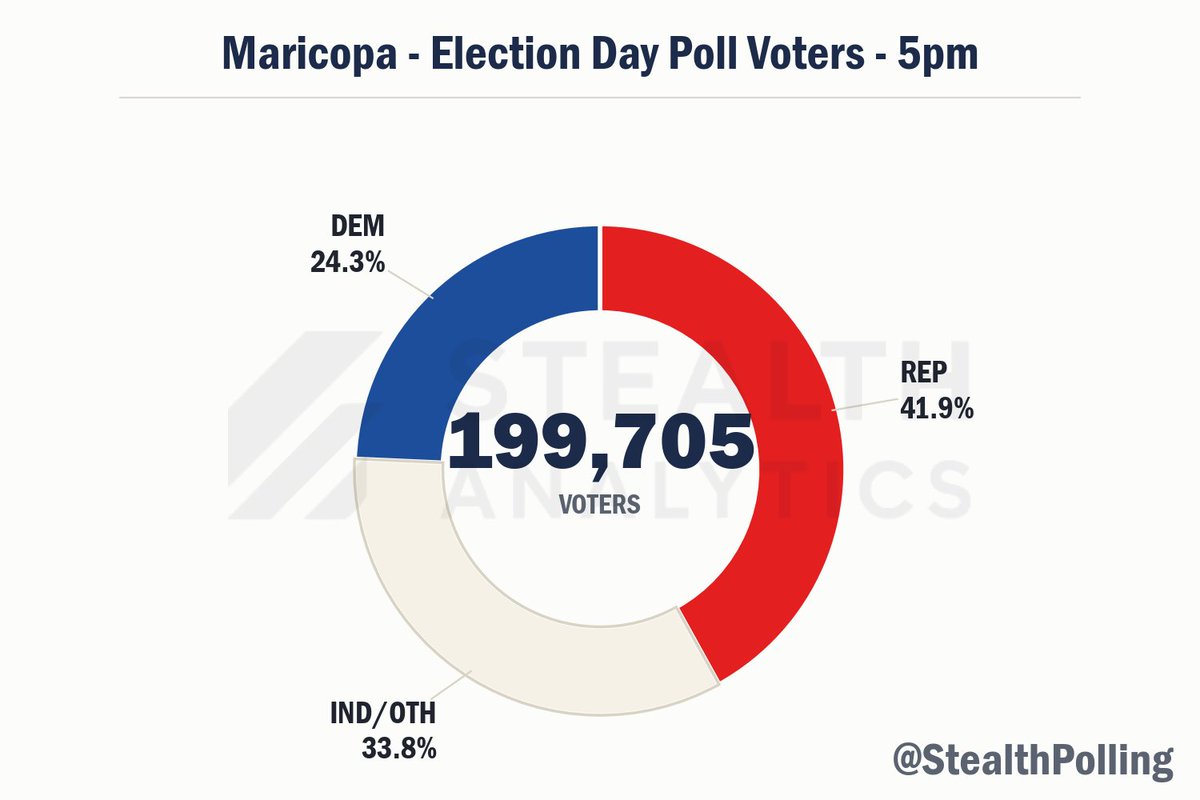
5 PM update.
🔴 Reps 83,764 (41.9%)
🔵 Dems 48,525 (24.3%)
⚪ Ind/Other 67,416 (33.8%)
Reps lead by 35,239 ballots (+17.6 pp) of 199,705 in.
Maricopa County general - Election Day ballots (11/3):
4 PM update.
🔴 Reps 73,742 (42.6%)
🔵 Dems 41,556 (24.0%)
⚪ Ind/Other 57,989 (33.5%)
Reps lead by 32,186 ballots (+18.6 pp) of 173,287 in.
Maricopa County general - Election Day ballots (11/3):
3 PM update.
151,176 at 254 vote centers. Includes early ballots, not just walk-ins.
🔴 Reps 65,165 (43.1%)
🔵 Dems 35,883 (23.7%)
⚪ Ind/Other 50,128 (33.2%)
Reps lead by 29,282 ballots (+19.4 pp) of 151,176 in.
Maricopa County general - Election Day ballots (11/3):
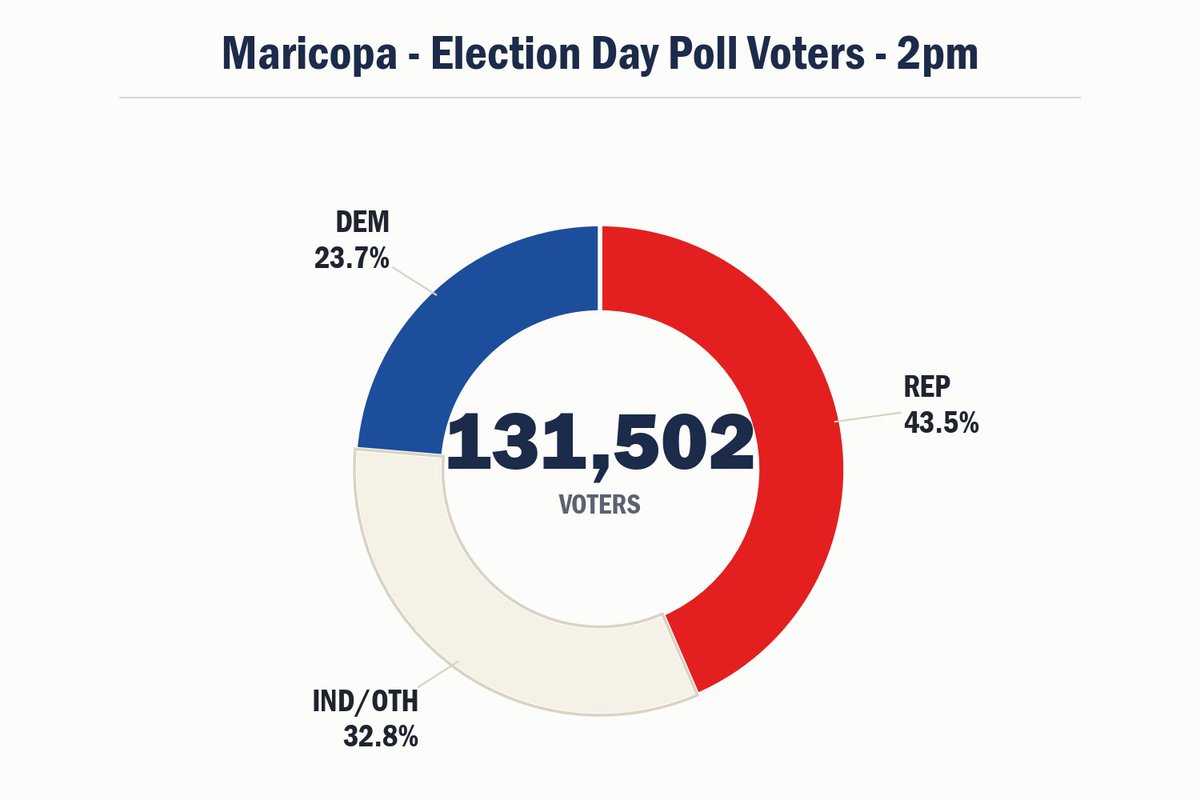
2 PM update.
131,502 at 254 vote centers. Includes early ballots, not just walk-ins.
🔴 Reps 57,222 (43.5%)
🔵 Dems 31,117 (23.7%)
⚪ Ind/Other 43,163 (32.8%)
Reps lead by 26,105 ballots (+19.9 pp) of 131,502 in.
Maricopa County general - Election Day poll voters (11/3):
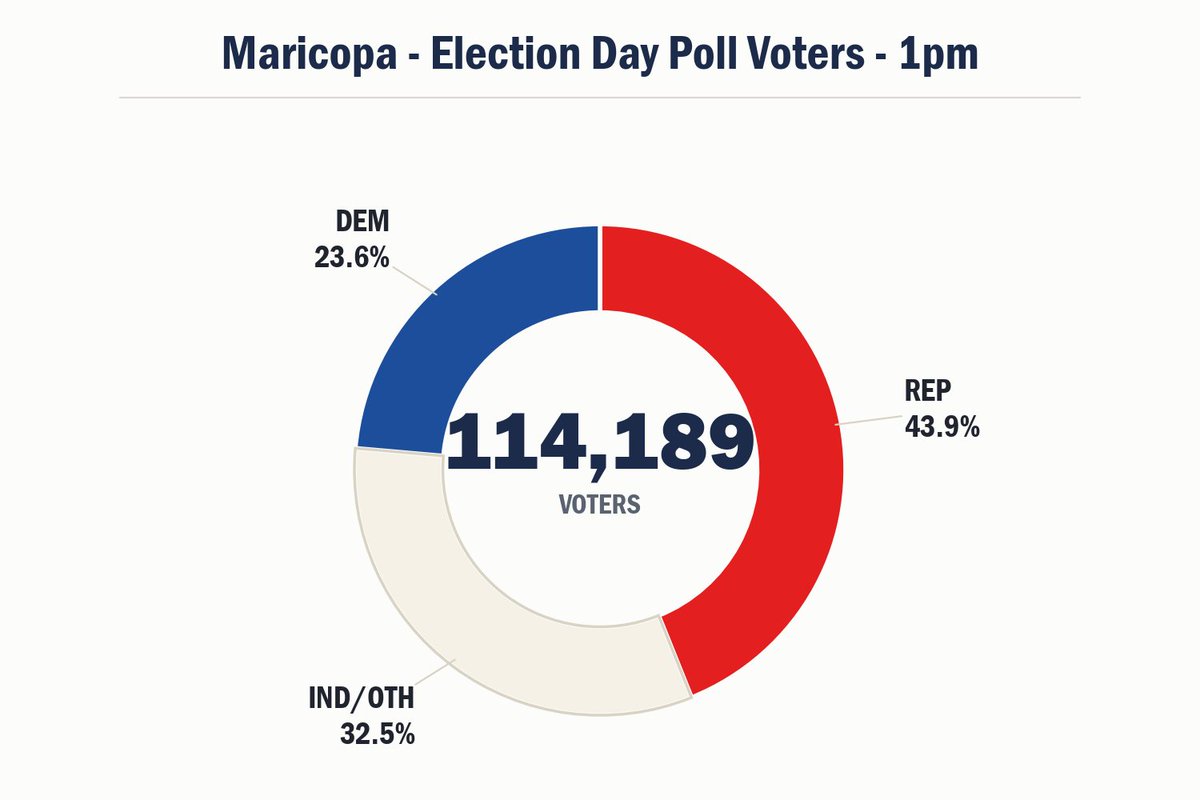
1 PM update.
114,189 have voted in person across 254 vote centers.
🔴 Reps 50,157 (43.9%)
🔵 Dems 26,960 (23.6%)
⚪ Ind/Other 37,072 (32.5%)
Reps lead by 23,197 ballots (+20.3 pp) of 114,189 in.
Approximately 96,287 voters have been served at a Vote Center as of 12 p.m. To find Vote Centers, live wait times, and secure drop boxes near you visit https://t.co/2Hs9CznUMi
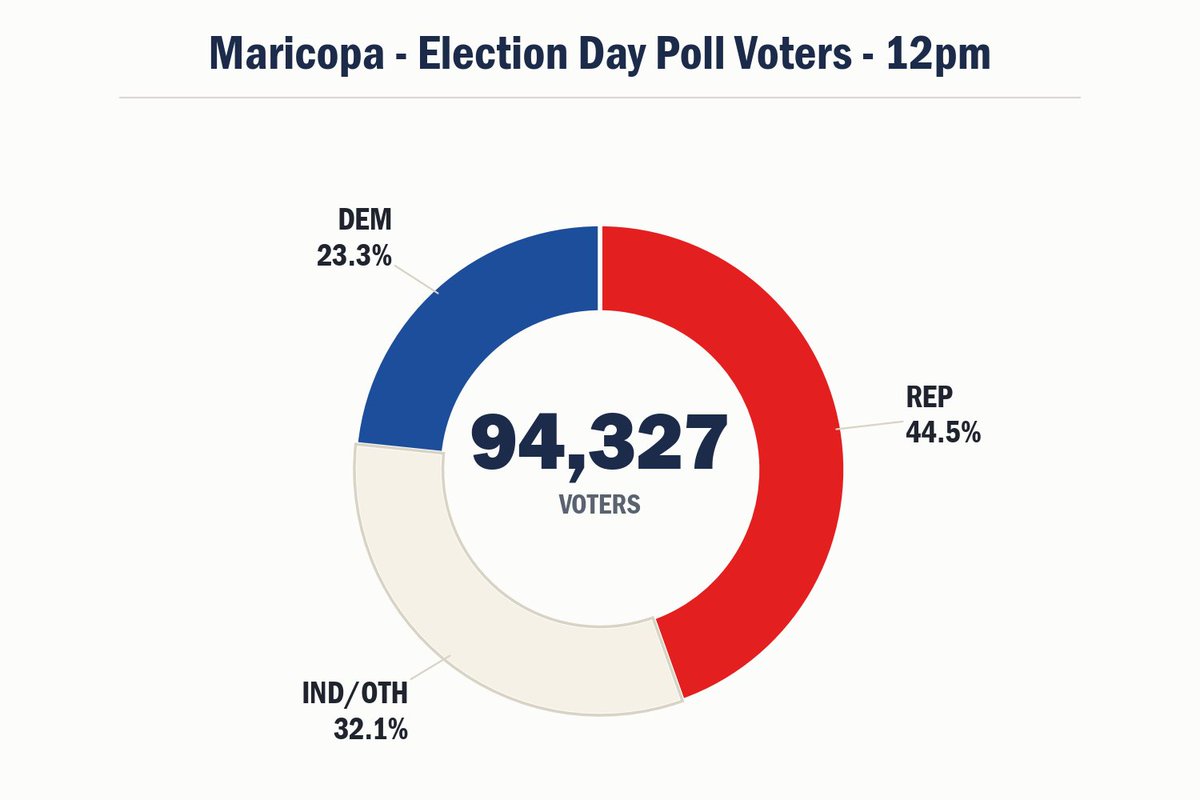
Maricopa County general - Election Day poll voters (11/3):
12 PM update.
94,327 have voted in person across 254 vote centers.
🔴 Reps 42,016 (44.5%)
🔵 Dems 22,021 (23.3%)
⚪ Ind/Other 30,290 (32.1%)
Reps lead by 19,995 ballots (+21.2 pp) of 94,327 in.
Pima County general - Election Day check-ins (11/3):
11 AM update.
26,724 have voted in person across 126 vote centers.
🔴 Reps 42.8%
🔵 Dems 25.7%
⚪ Ind/Other 31.5%
Reps lead by 17.1 points of 26,724 in.
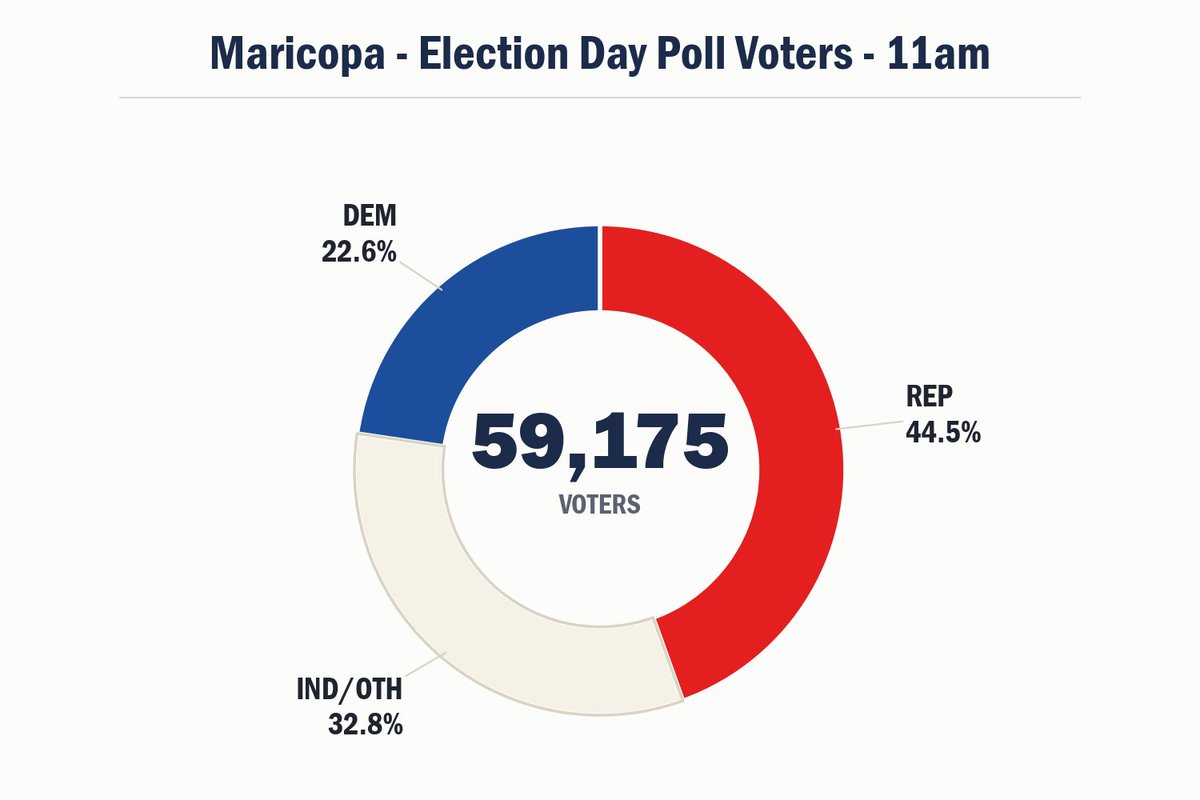
Maricopa County general - Election Day poll voters (11/3):
11 AM update.
59,175 have voted in person across 254 vote centers.
🔴 Reps 26,348 (44.5%)
🔵 Dems 13,403 (22.6%)
⚪ Ind/Other 19,424 (32.8%)
Reps lead by 12,945 ballots (+21.9 pp) of 59,175 in.
Approximately 59,100 voters have been served at a Vote Center as of 10 a.m. To find Vote Centers, live wait times, and secure drop boxes near you visit https://t.co/2Hs9CznmWK
Maricopa County general - Election Day poll voters (11/3):
10 AM update.
44,637 have voted in person across 254 vote centers.
🔴 Reps 19,861 (44.5%)
🔵 Dems 10,227 (22.9%)
⚪ Ind/Other 14,549 (32.6%)
Reps lead by 9,634 ballots (+21.6 pp) of 44,637 in.
Good question. From our July primary data, in-person voting climbs all day and peaks 5-6 PM. Mornings are actually the slowest stretch.
Roughly a third of the day's in-person votes came in after 4 PM. Only 19% before 10 AM.
Pima showed the same shape: small 10 AM bump, midday dip, 5 PM peak.
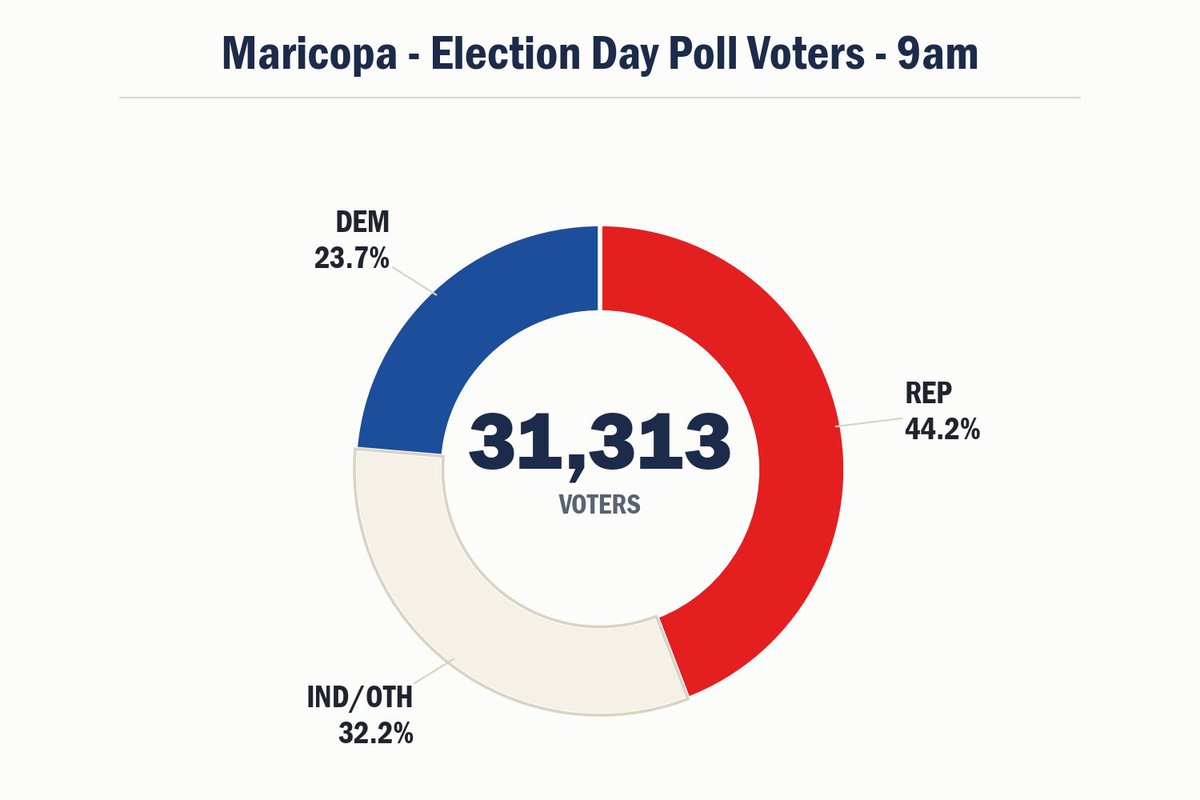
Maricopa County general - Election Day poll voters (11/3):
9 AM update.
31,313 have voted in person across 254 vote centers.
🔴 Reps 13,831 (44.2%)
🔵 Dems 7,407 (23.7%)
⚪ Ind/Other 10,075 (32.2%)
Reps lead by 6,424 ballots (+20.5 pp) of 31,313 in.
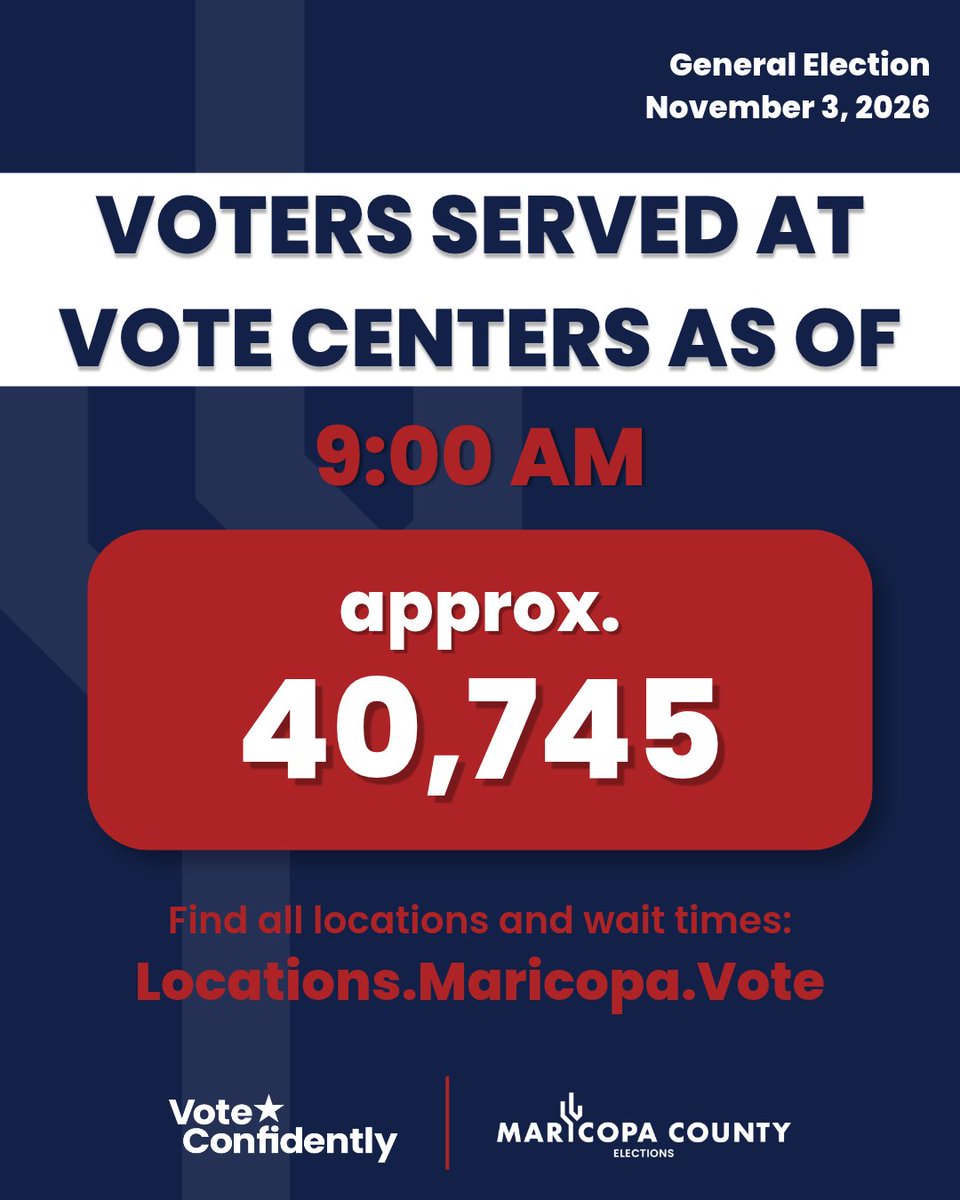
Approximately 40,745 voters have been served at a Vote Center as of 9 a.m. To find Vote Centers, live wait times, and secure drop boxes near you visit https://t.co/2Hs9CznmWK