Systematic/algorithmic U.S. swing trader | Maximally curious | Sharing visual factual info & not opinions (NFA) To strive, to seek, to find, and not to yield
Relative Trend Strength - Is It A Watchlist? 🤨
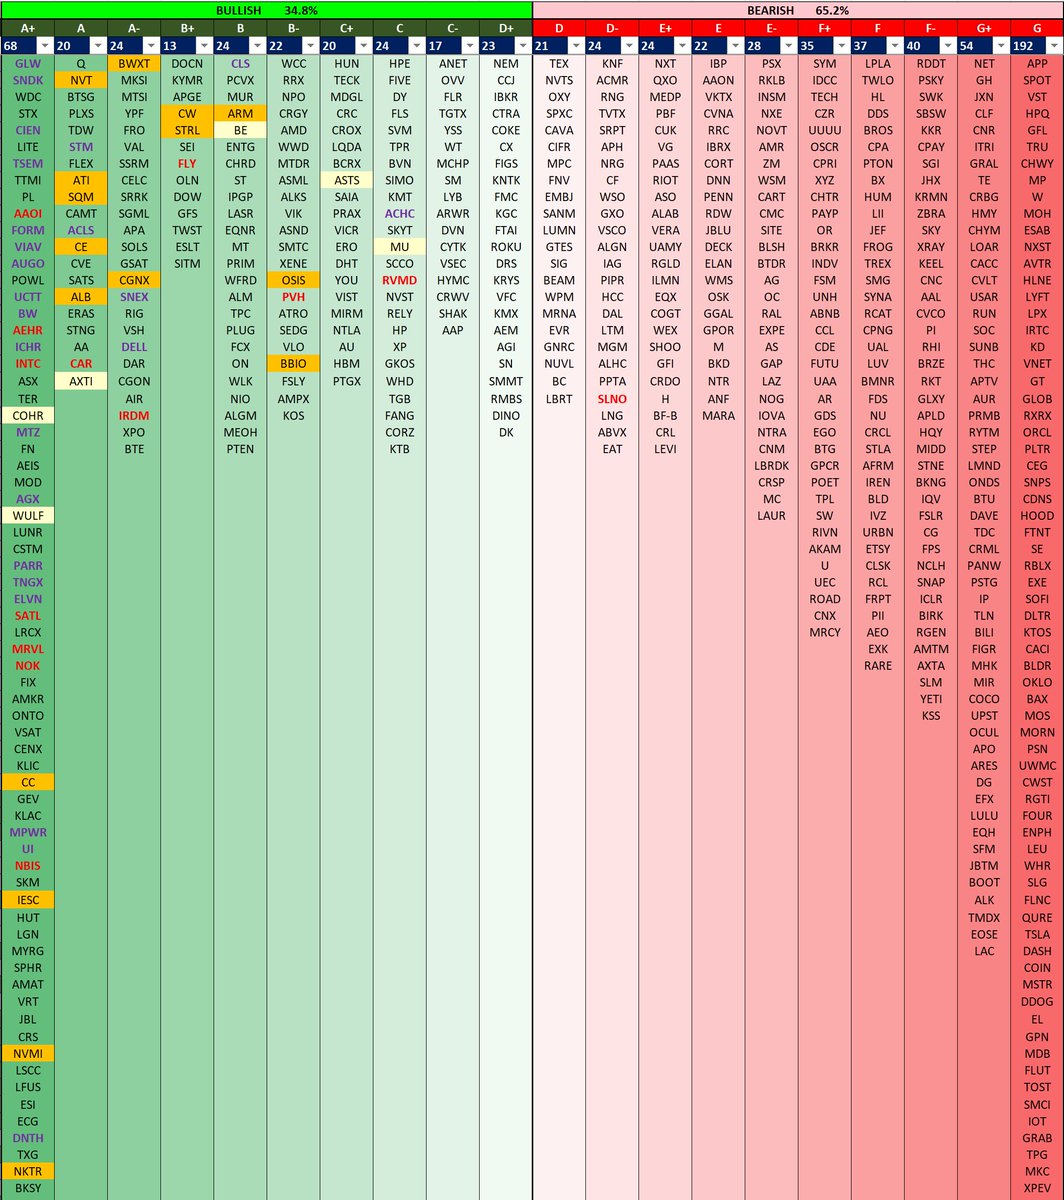
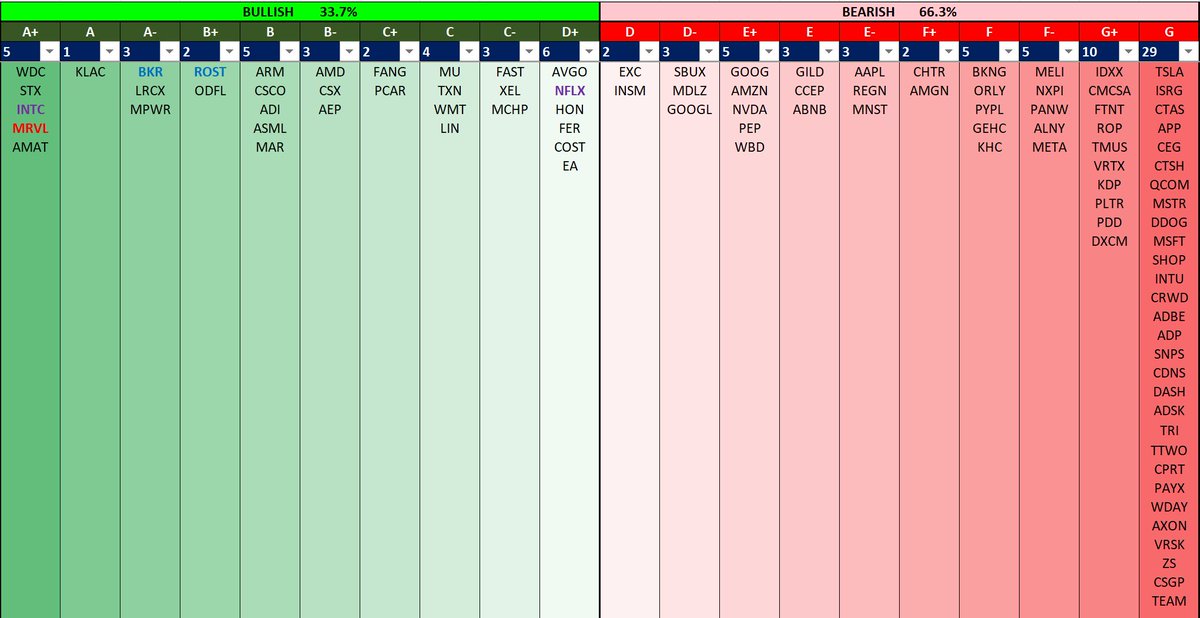
The Relative Trend Strength (RTS) grades stocks based on two components:
1) Relative* Strength
2) Trend Strength
It is NOT a watchlist but rather a categorization of all stocks into grades A+ to G based on their Relative Trend Strength (RTS).
Stocks in the A+ columns, particularly the red font (7x or greater ATR-to-SMA50 and purple font (5x to 7x ATR-to-SMA50) are already over/too extended to initiate new positions ... they are great if you are in from much lower which some people are.
Watchlist stocks are highlighted in orange/yellow cell colors. There are currently none in the $QQQE because as you stated, and I fully agree with you, many stocks have run significantly in the past 5-10 days and it would be healthy to have a pullback to ascending moving averages and/or sideways consolidation/digestion.
The RTS can be useful for determining market health and sentiment - currently ~ 1/3 are on the left side but some stocks such as $GOOG and $NVDA are D- so there may be some opportunities arise here if they improve (and move to the left columns).
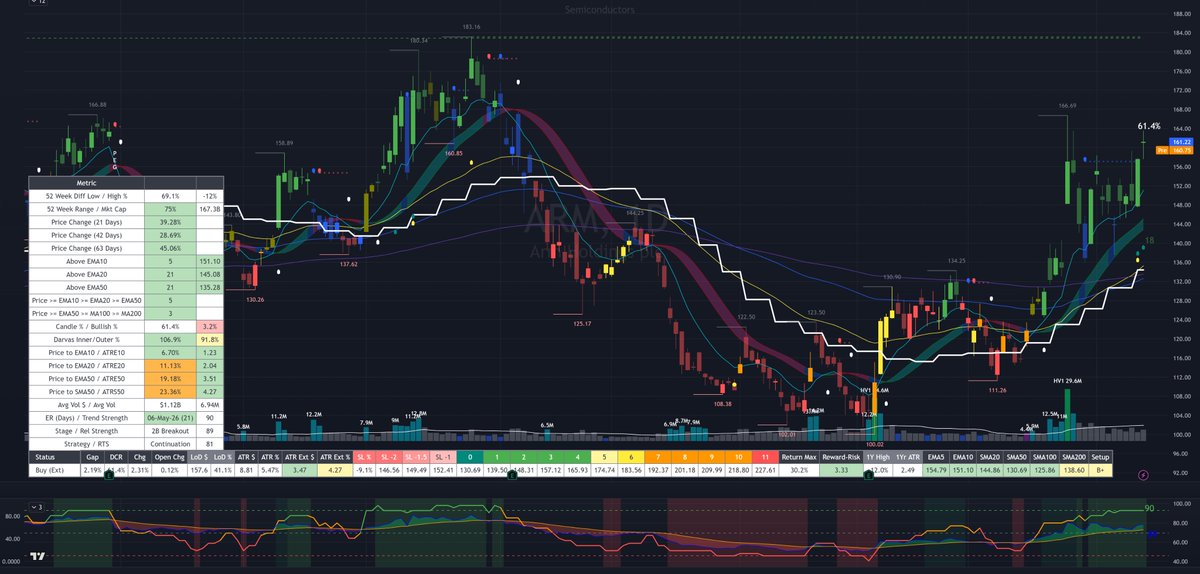
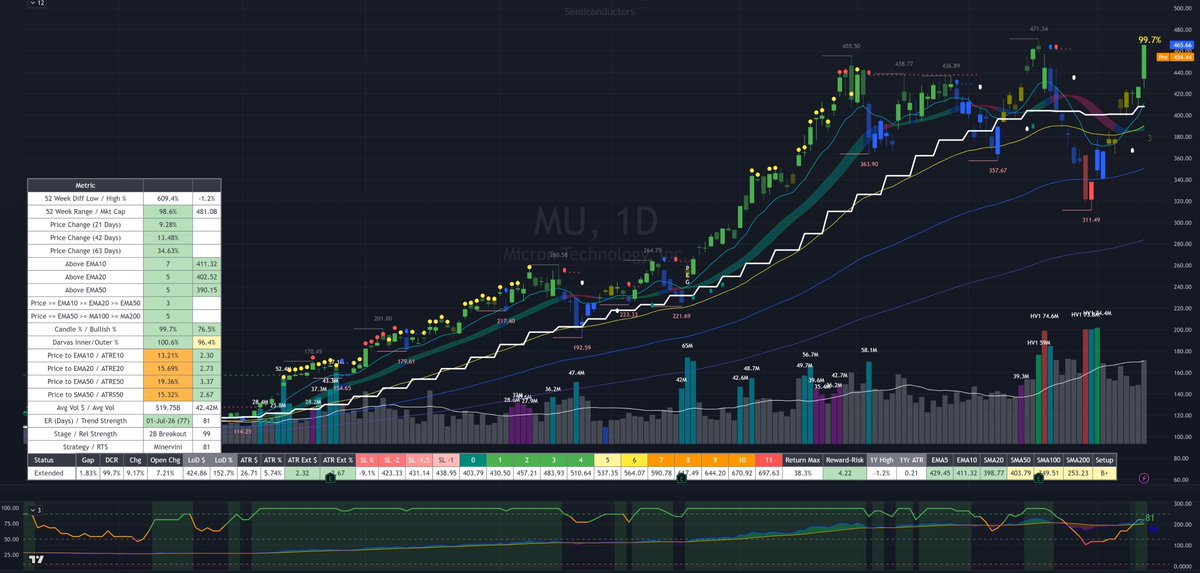
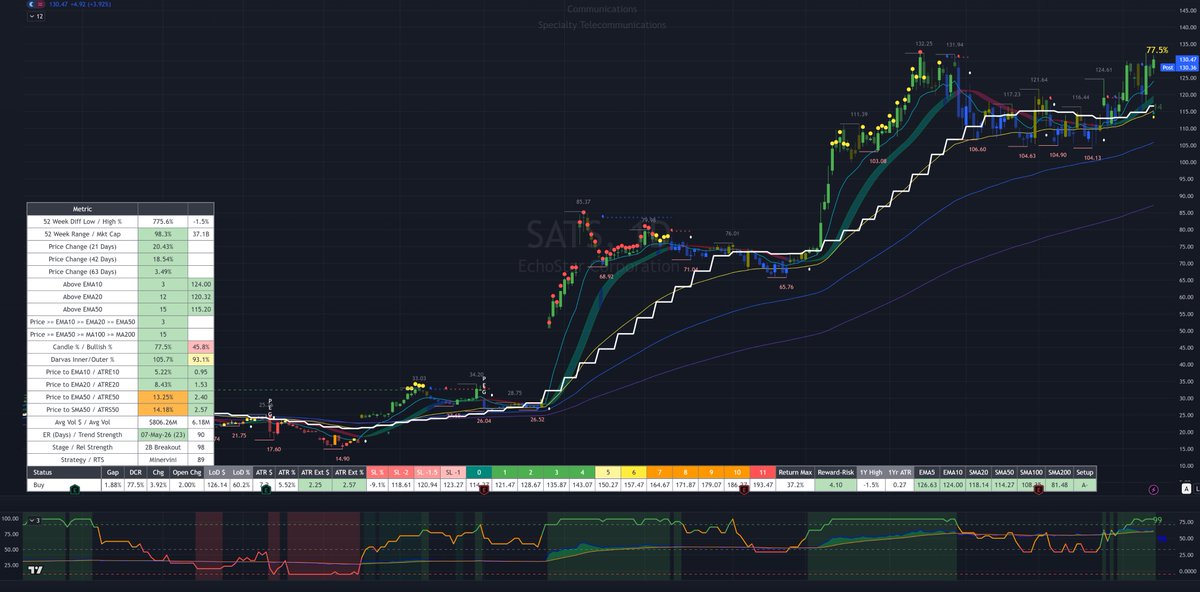
Looking at a combined universe of $SPY and $QQQ, it can be seen that there are a handful of watchlist stocks such as $SATS $ARM $MU - it doesn't mean rush out and buy them - they are just (what I consider) favorable setups that could be watched for pilot positions based on your own personal entry tactics.
Market trump sector/industry and sector/industry trump individual stocks. Given the recent strength in the market there may be some digestion/sideways/pullbacks on the horizon. Energy ( $XLF) is already at a 20-day low, along with $XOM and $CVX etc.
If the conflict ends and the strait of Hormuz is reopened fully to all traffic, the flow of oil, gas and fertilizers will be restored (over time) and the market may get a further bump. Maybe this will lead to sector/industry rotation. Nobody knows ... the goal is to follow price and volume action to determine objectively the new True Market Leaders (TMLs) as they emerge.
* More correctly it is Absolute Strength (AS) as it is comparing the strength of all stocks to each other and not to an index or benchmark.
📈 Relative Trend Strength: S&P500💪 $SPY
A+ Setups
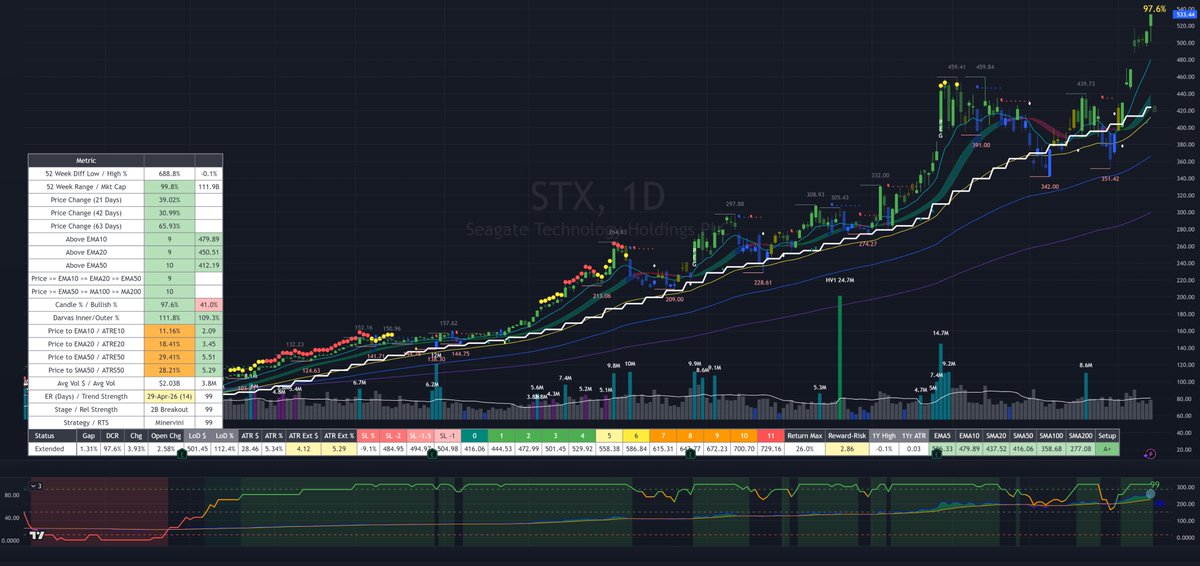
$SNDK $WDC $STX $CIEN $LITE $COHR $INTC $GLW $VRT $FIX $TER $LRCX $GEV $KLAC $MPWR $KEYS $AMAT $JBL $ALB $C $Q
Relative Trend Strength grades stocks based on their Relative Strength AND Trend Strength.
A+ stocks have both the highest RS AND strongest price structure trend.
Red font => over-extended 7x ATR-to-SMA50 or greater
Purple font => extended 5x ATR-to-SMA50 or greater
Blue font => below average ATR
📈 Relative Trend Strength: Nasdaq-100💪 $QQQ
A+ Setups
$WDC $STX $INTC $MRVL $LRCX $KLAC
Relative Trend Strength grades stocks based on their Relative Strength AND Trend Strength.
A+ stocks have both the highest RS AND strongest price structure trend.
Red font => over-extended 7x ATR-to-SMA50 or greater
Purple font => extended 5x ATR-to-SMA50 or greater
Blue font => below average ATR
📈 Relative Trend Strength For Swing Traders *💪
+ watchlist stocks highlighted
Relative Trend Strength grades stocks based on their Relative Strength AND Trend Strength.
A+ stocks have both the highest RS AND strongest price structure trend.
Yellow / Orange cells => Watchlists 1/2
Red font => over-extended 7x ATR-to-SMA50 or greater
Purple font => extended 5x ATR-to-SMA50 or greater
*Above Avg. ATR + 50M daily $ volume
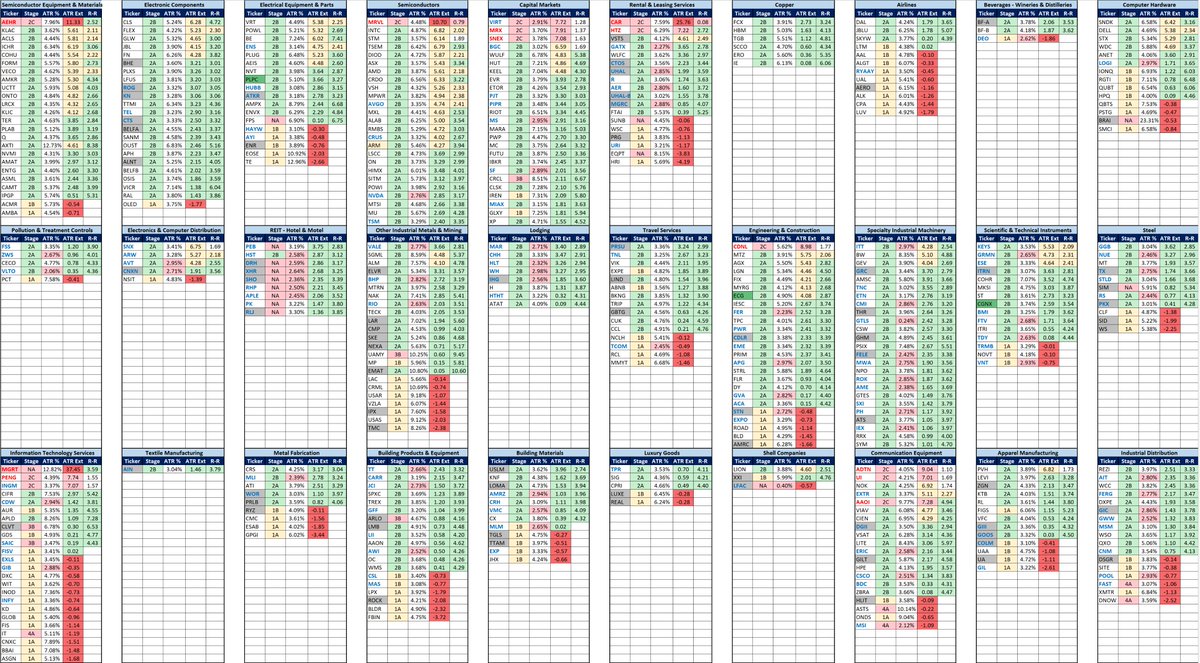
📈Leading Stocks In Leading Industries
This is an alternate view of the leading* Industries and the stocks within them. It includes:
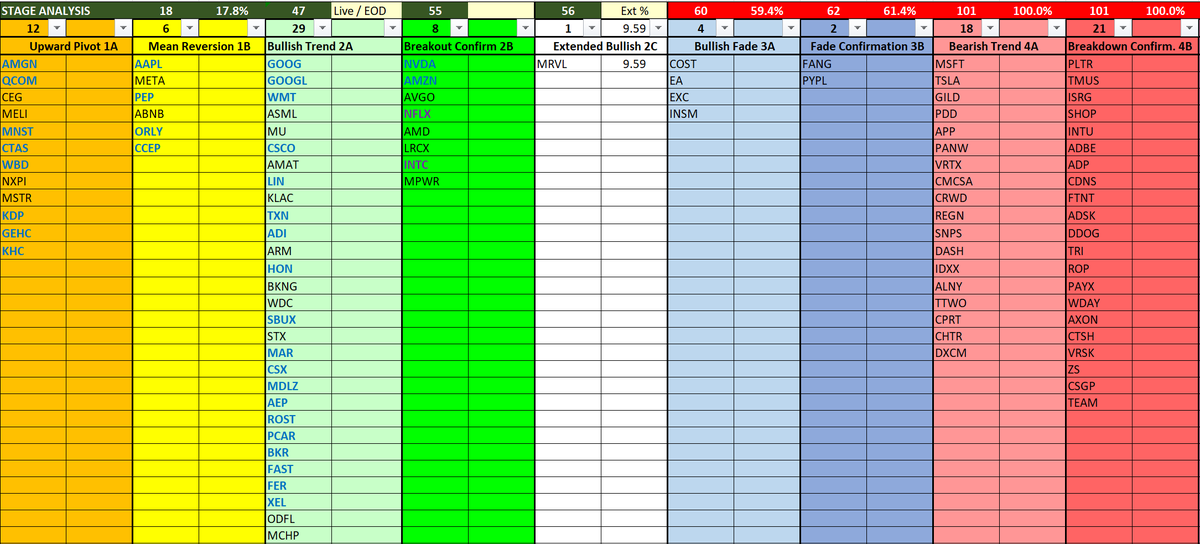
- Stage Analysis
- ATR%
- ATR Extension
- Reward-to-Risk (projected)
This can be useful when building your watchlist 👀as you want to "focus on leading stocks in leading industry groups" - William O'Neil.
* top 20% (30 Finviz Industries)
Data provided by: @finviz_com
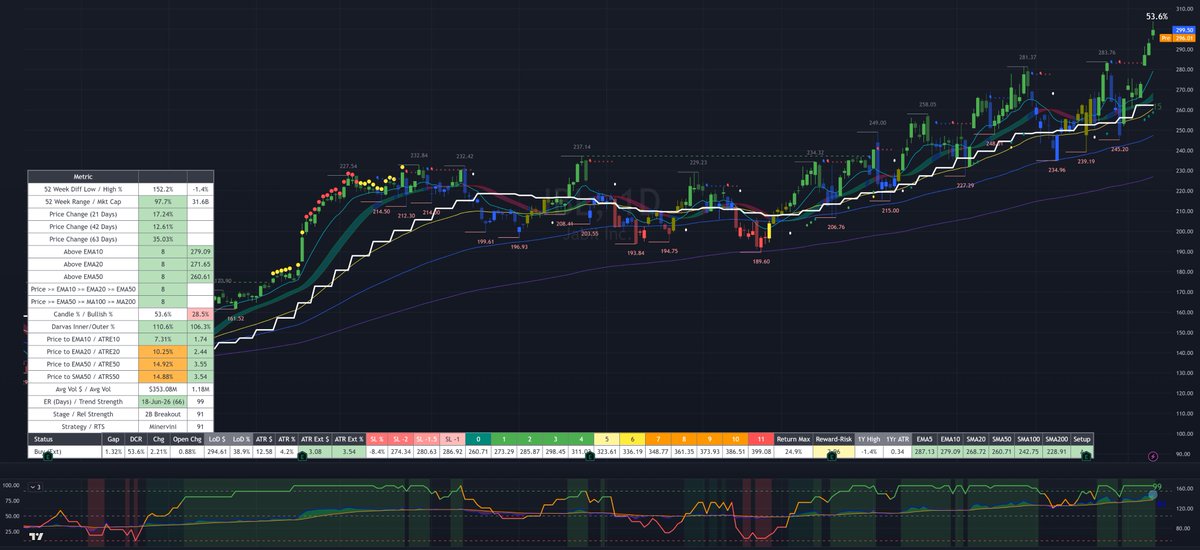
$CAR Parabolic Move Incoming?📈
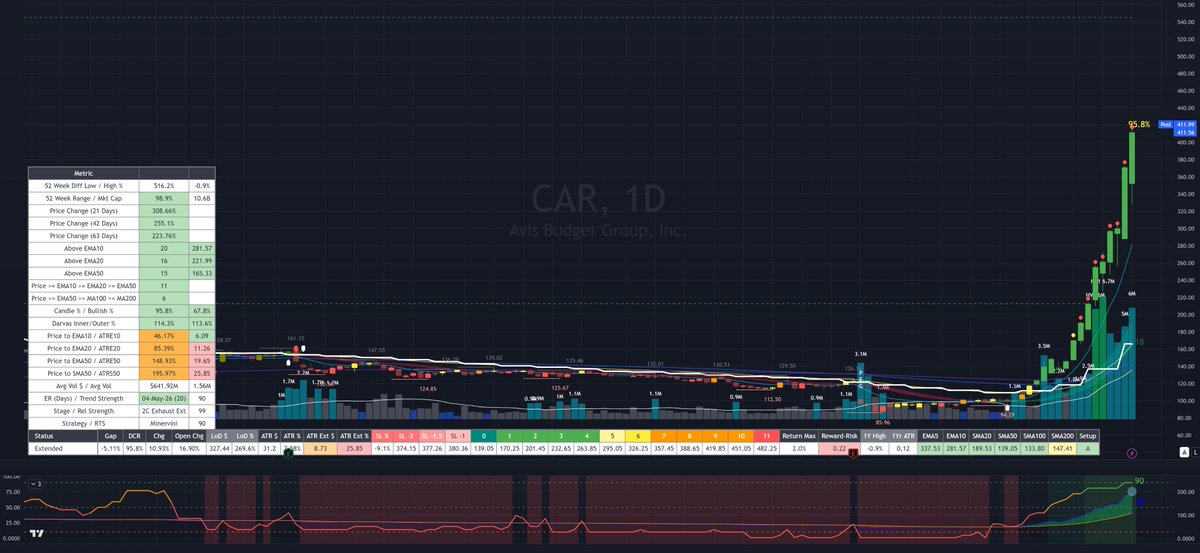
CAR closed at $411.56 which is the highest close in its history. It is now 25.85x ATR-to-SMA50, making it 2x the next $1B+ market cap stock ( $LWLG)
At 6 million shares traded today, the volume is still not extreme and it has yet to have a parabolic blow-off top, although it could easily spike to $517.91 (when over 20M shares traded) which is only a 25.8% move from here.
Today's change was 10.93% and 16.90% from open so it could be at a new all-time intraday high in 1-2 days.
Hopefully the shorts trapped from much lower have deep pockets💰 ...
https://t.co/d427KuYVLg
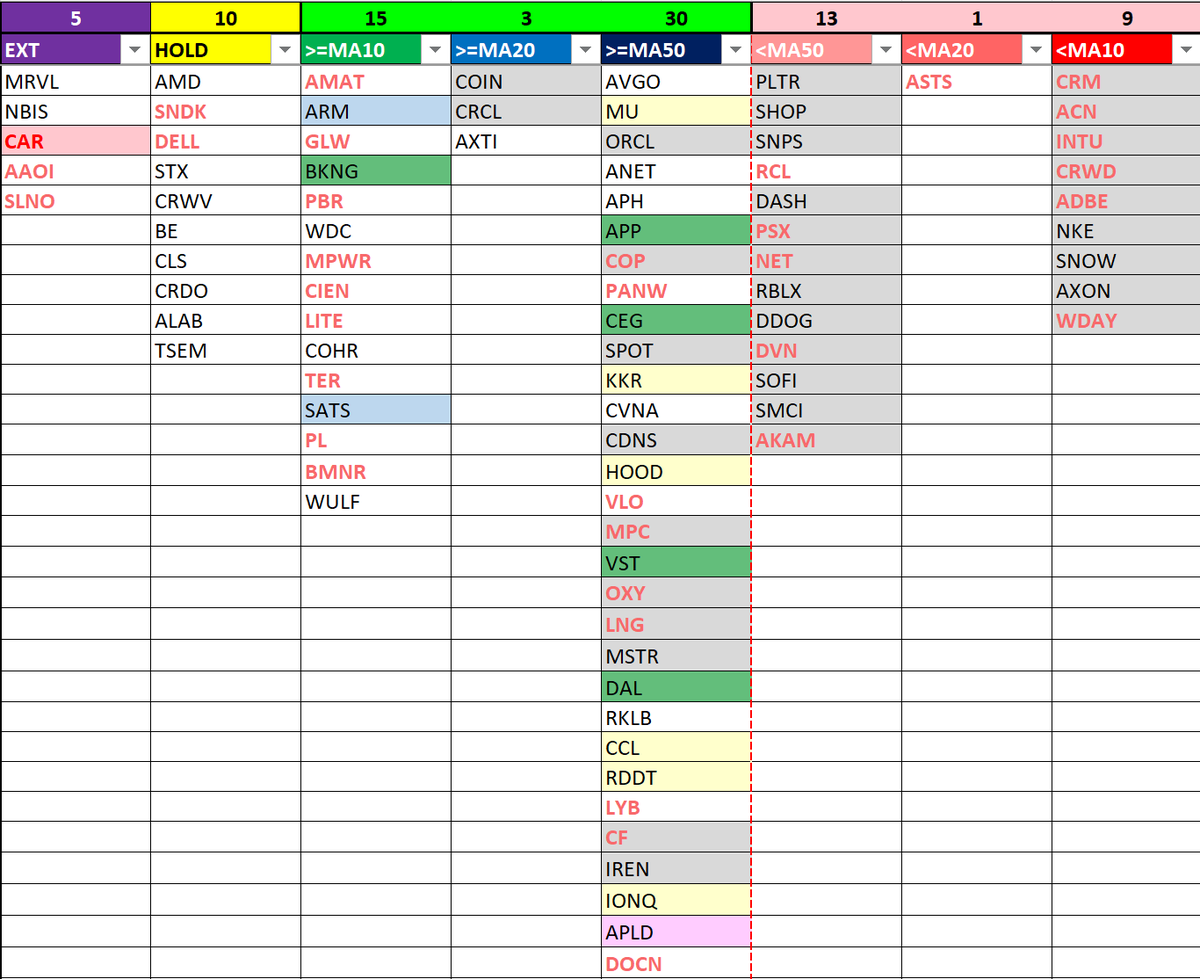
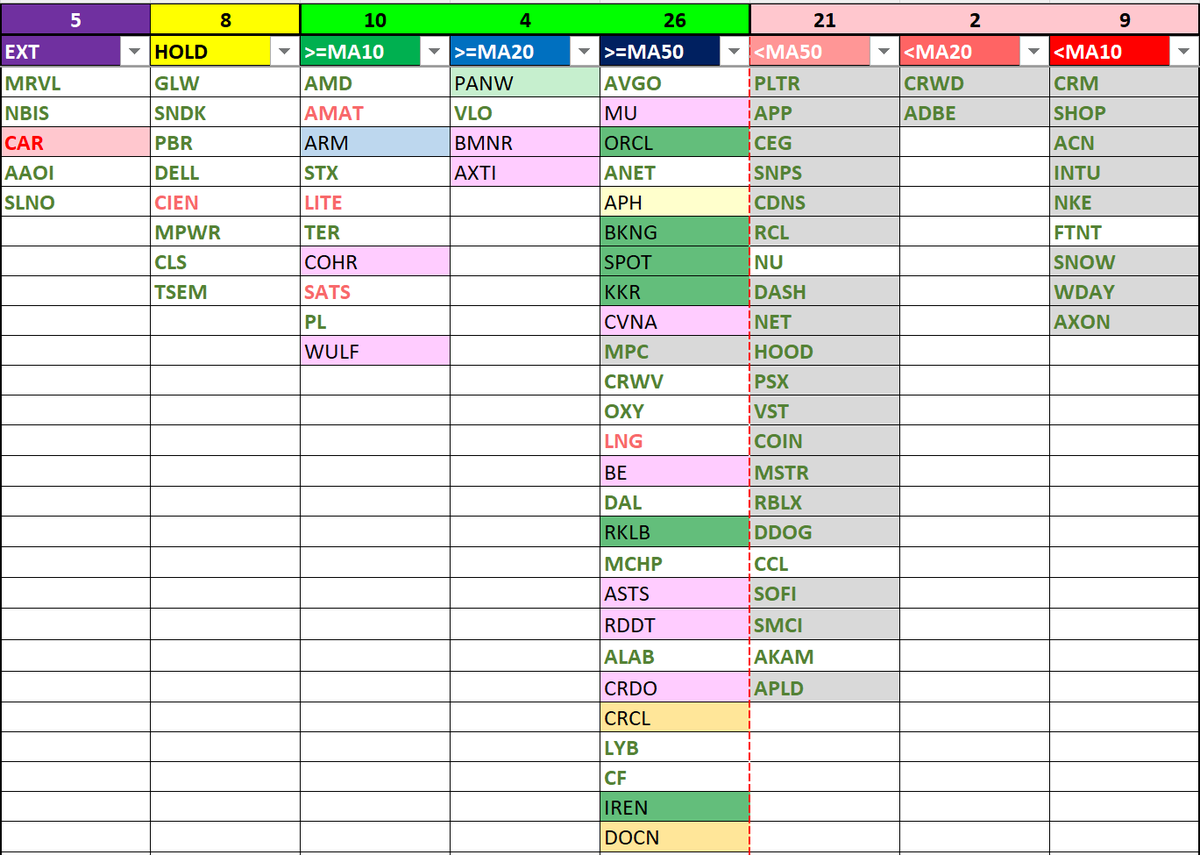
💧📈 Liquid Leader Stock Scan: Price Structure 📉
86 stocks* grouped into columns based on the price structure of key moving averages at close
Watchlist 👀
Backtest Scan: $APLD
Scan B: $ARM $SATS
Scan 1: $BKNG $APP $CEG $VST $DAL
Scan 3: $MU $KKR $HOOD $CCL $RDDT $IONQ
⚠️ $CAR closed at THE highest extension and price in its history. It is also the most extended in its history at 25.85x ATR-to-SMA50 on the daily time-frame
Green font color means the daily candle is green (day and open change are both positive)
Red font color means the daily candle is red (day and open change are both negative)
Pale grey cell color indicates the trend is negative
* daily $ vol >= $500M
If $CAR closes above $339.35 it will be a new all-time-high close at 23x ATR-to-the-SMA50
Shorts are getting run over 🧍🚗💨
https://t.co/eAoEBEnuwG
https://t.co/hMOUCiYpk0
💧📈 Liquid Leader Stock Scan: Price Structure 📉
85 stocks* grouped into columns based on the price structure of key moving averages at close
Watchlist 👀
Backtest Scan: $COHR $WULF $BMNR $AXTI $MU $CVNA $BE $ASTS $RDDT $CRDO
Scan B: $ARM
Scan 1: $ORCL $BKNG $KKR
Scan 3: $APH
Scan 4: $CRCL $DOCN
⚠️ $CAR closed at THE highest extension and price in its history. It is also the most extended in its history at 24.7x ATR-to-SMA50 on the daily time-frame
Green font color means the daily candle is green (day and open change are both positive)
Red font color means the daily candle is red (day and open change are both negative)
Pale grey cell color indicates the trend is negative
* daily $ vol >= $500M
📈 Relative Trend Strength For Swing Traders *💪
+ watchlist stocks highlighted
Relative Trend Strength grades stocks based on their Relative Strength AND Trend Strength.
A+ stocks have both the highest RS AND strongest price structure trend.
Yellow / Orange cells => Watchlists 1/2
Red font => over-extended 7x ATR-to-SMA50 or greater
Purple font => extended 5x ATR-to-SMA50 or greater
*Above Avg. ATR + 50M daily $ volume
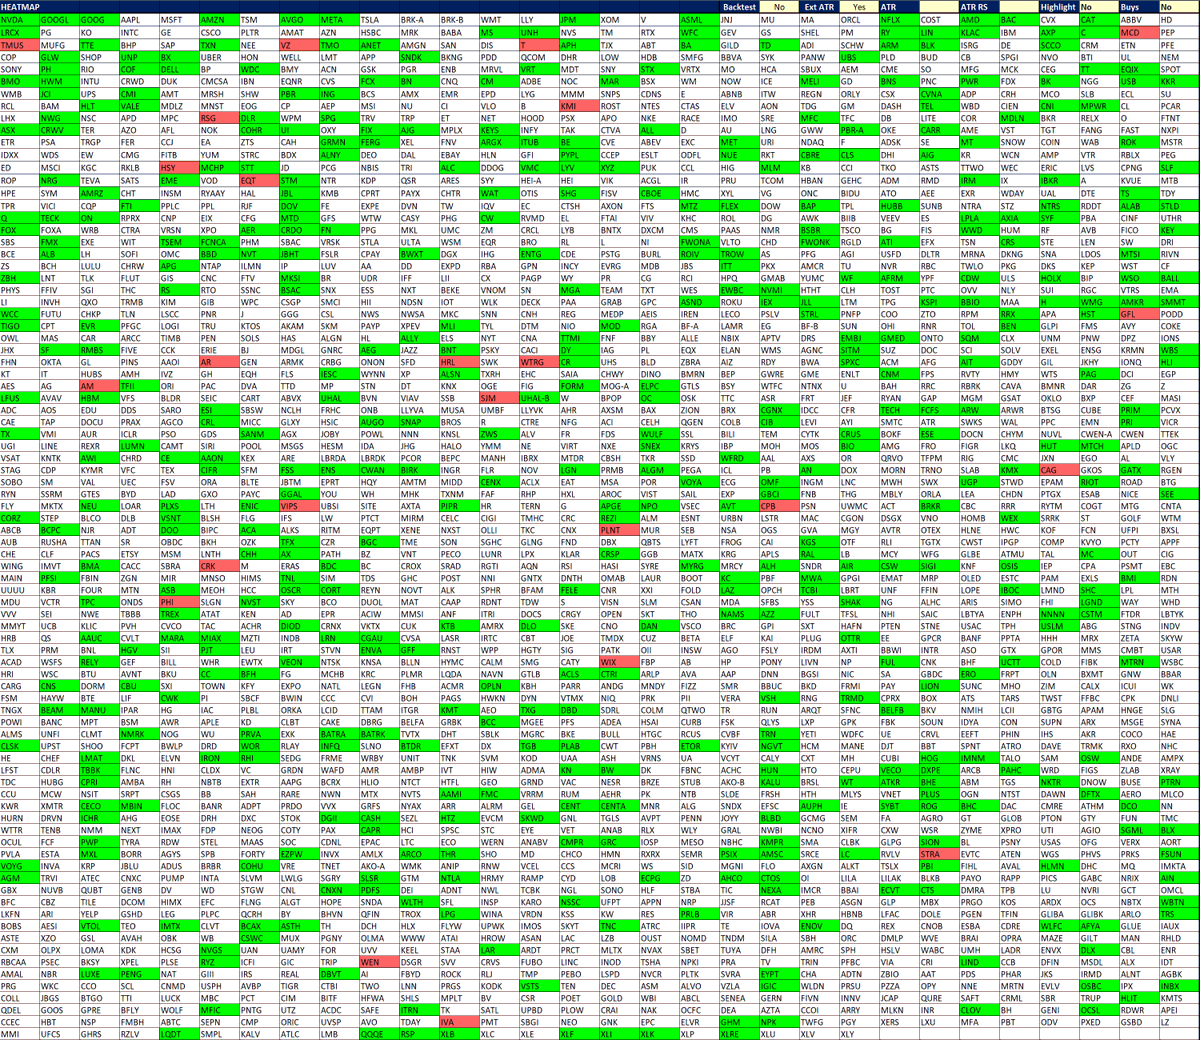
📈Darvas Box Heatmap
Tell me the stock market is on 🔥 without telling me
📈478 Breakouts vs 24 Breakdowns 📉 (19.9-to-1)
This "Heatmap" can be useful to gauge market sentiment and sector rotation.
🟢 is new 20-day high (potential long ideas)
�� is 20-day low (possible short ideas).
📈 Relative Trend Strength: S&P500💪 $SPY
A+ Setups
$GLW $SNDK $WDC $STX $CIEN $LITE $INTC $GEV $COHR $TER $LRCX $AMAT $KLAC $FIX $VRT $KEYS $JBL $Q $SLB $SATS
Relative Trend Strength grades stocks based on their Relative Strength AND Trend Strength.
A+ stocks have both the highest RS AND strongest price structure trend.
Red font => over-extended 7x ATR-to-SMA50 or greater
Purple font => extended 5x ATR-to-SMA50 or greater
Blue font => below average ATR
📈 $CAR Parabolic Extension 10-Year History ⚠️
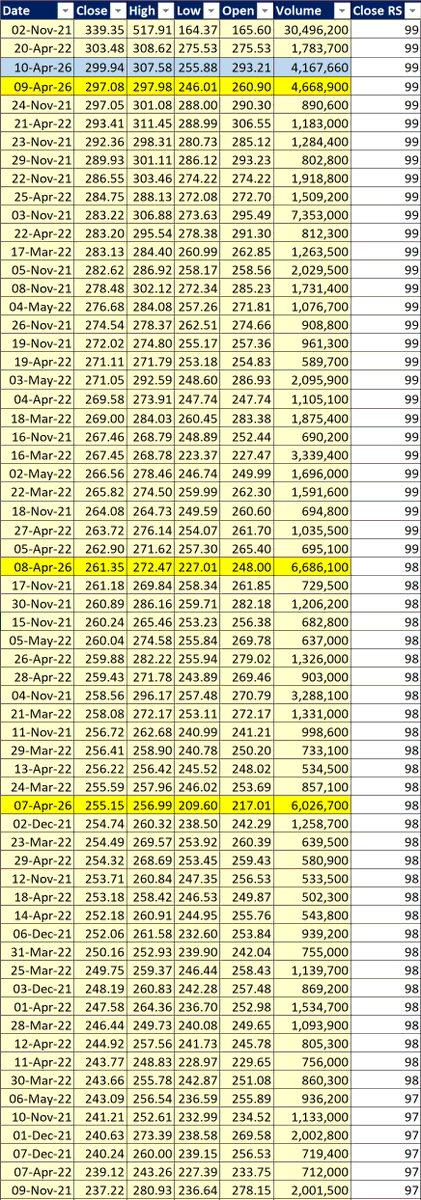
ℹ️ A close above $303.48 will be the 2nd highest close in 10 years while a close above $339.35 will be a new 10-year closing high 🌡️
Metric 1: Closing Prices (Pic 1)
On Friday, $CAR closed at $299.94 which is the 3rd highest closing price in 10 years (a total of 2,834 trading days).
On the 20th April 22, CAR closed at $303.48 (the 2nd highest close) after reaching and intraday high of $308.62
Even on the 2nd November 21, CAR only managed to close at $339.35 (13.1% high than Fridays close) after a parabolic blow-off of reaching an intraday high of $517.91
Metric 2: Volume (Pic 2)
From a volume perspective, the 8th April 26 was the highest volume this year at 6.69M shares.
This is only the 70th largest volume (top 2.4% percentile in terms of 2834 trading sessions) traded in the 10-years so the short squeeze has not caused capitulation.
However, within the last 5 years there were only 2 days with higher volume traded:
2nd Place: On 3rd Nov 21, 7.353M shares traded and
1st Place: On 2nd Nov 21, 30.5M shares traded on the day of the parabolic blow off top.
$CAR is extended by almost all metrics and based on the historical price data. It is a crowded short with many eyes currently watching it for it to break lower.
CAR at 18x ATR-to-SMA50 is THE most extended stock in the $1B+ market cap universe ... and there are only 18 stocks that are 7x ATR or greater (pic4)
Can the current shorts withstand a repeat of the 2nd November or will CAR simply drift lower or go sideways over an extended period of time frustrating everyone who has open positions and those watching it?
As Mark Twain said “History Doesn’t Repeat Itself, but It Often Rhymes” so a mean reversion is likely - it is just a case of how long that reversion takes.
It could be argued that $CAR is in worse financial shape now than over the past ten years since:
1) Unprofitability
For the fiscal year ending 2025, the company reported a net loss of $889 million, following a massive $1.82 billion loss in 2024. This is a sharp reversal from its record profit of $2.76 billion in 2022.
2) Negative Equity
CAR currently operates with negative shareholder equity of approximately -$3.04 billion. Its total liabilities ($34.3 billion) now exceed its total assets ($31.3 billion).
3) Heavy Debt Burden
Total debt has climbed to $25.3 billion. The interest coverage ratio has dropped to 0.44, meaning the company is struggling to generate enough earnings to cover its interest payments.
4) Negative Cash Flow
Free cash flow for the trailing twelve months ending December 2025 was a loss of $1.5 billion, a significant decline from the positive cash flows seen during its 2021–2022 recovery period.
5) EV Strategy Impact
Recent losses are partly due to impairment charges (e.g., $518 million in late 2025) related to aggressive fleet rotations and devaluing electric vehicle (EV) assets
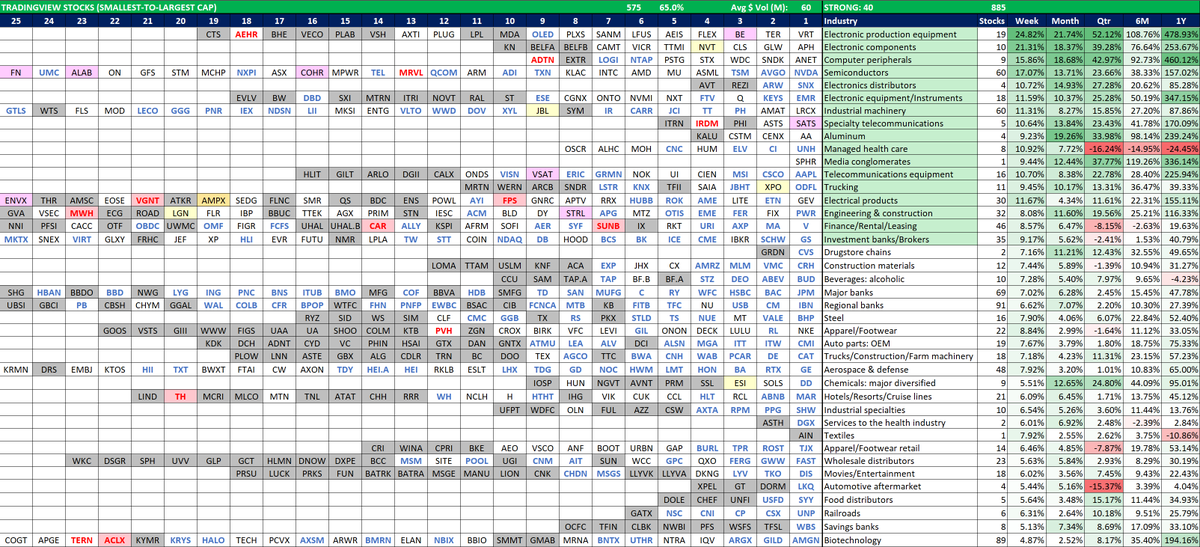
📈Leading Stocks In Leading Industries (TradingView)
The chart shows largest stocks in the strongest industry groups, based on "Week x Month" Relative Strength (RS)
🏭Industries: sorted ⬆️ strongest-weakest ⬇️
Stocks: sorted ⬅️smallest-to-largest ➡️market cap
“You want to own the leading stocks in the leading industry groups.” - William O'Neil
* Daily $ Vol >= $50M
📈 Relative Trend Strength: Nasdaq-100💪 $QQQ
A+ Setups
$WDC $STX $INTC $MRVL $AMAT
Relative Trend Strength grades stocks based on their Relative Strength AND Trend Strength.
A+ stocks have both the highest RS AND strongest price structure trend.
Red font => over-extended 7x ATR-to-SMA50 or greater
Purple font => extended 5x ATR-to-SMA50 or greater
Blue font => below average ATR
Correction:
Where it states "Trading 2:30pm to 3:30pm", this is GMT/BST.
It should read "Trading the first hour of the regular market session, whatever timezone that is for you".