If you look at my last 100 trades. They all broadly look the same in terms of charts, just the names change.
50% of these would have ended up in loss/breakeven.
40% of these would be small winners.
10% of these significant winners that would make an impact on PF
But all 100 charts look the same. That's the moral of the tweet
Qullamaggie on Leaders Want to Go Higher
“You can clearly see like all the leading stocks are green. Like almost all of the stocks in my portfolio are green today, and also the ones in my watchlist. They’re all green while the NASDAQ overall is down on the day — so you can clearly see the leaders are up. They wanna go higher, right? You’re just screaming in our faces — we want to go higher. But the problem is, if the market dumps, they’re all gonna dump too. That’s the problem.”
“It’s not about whether you’re right or wrong,
it’s all about how much money you make when you’re right & how much you lose when you’re wrong”
Position Sizing is King.
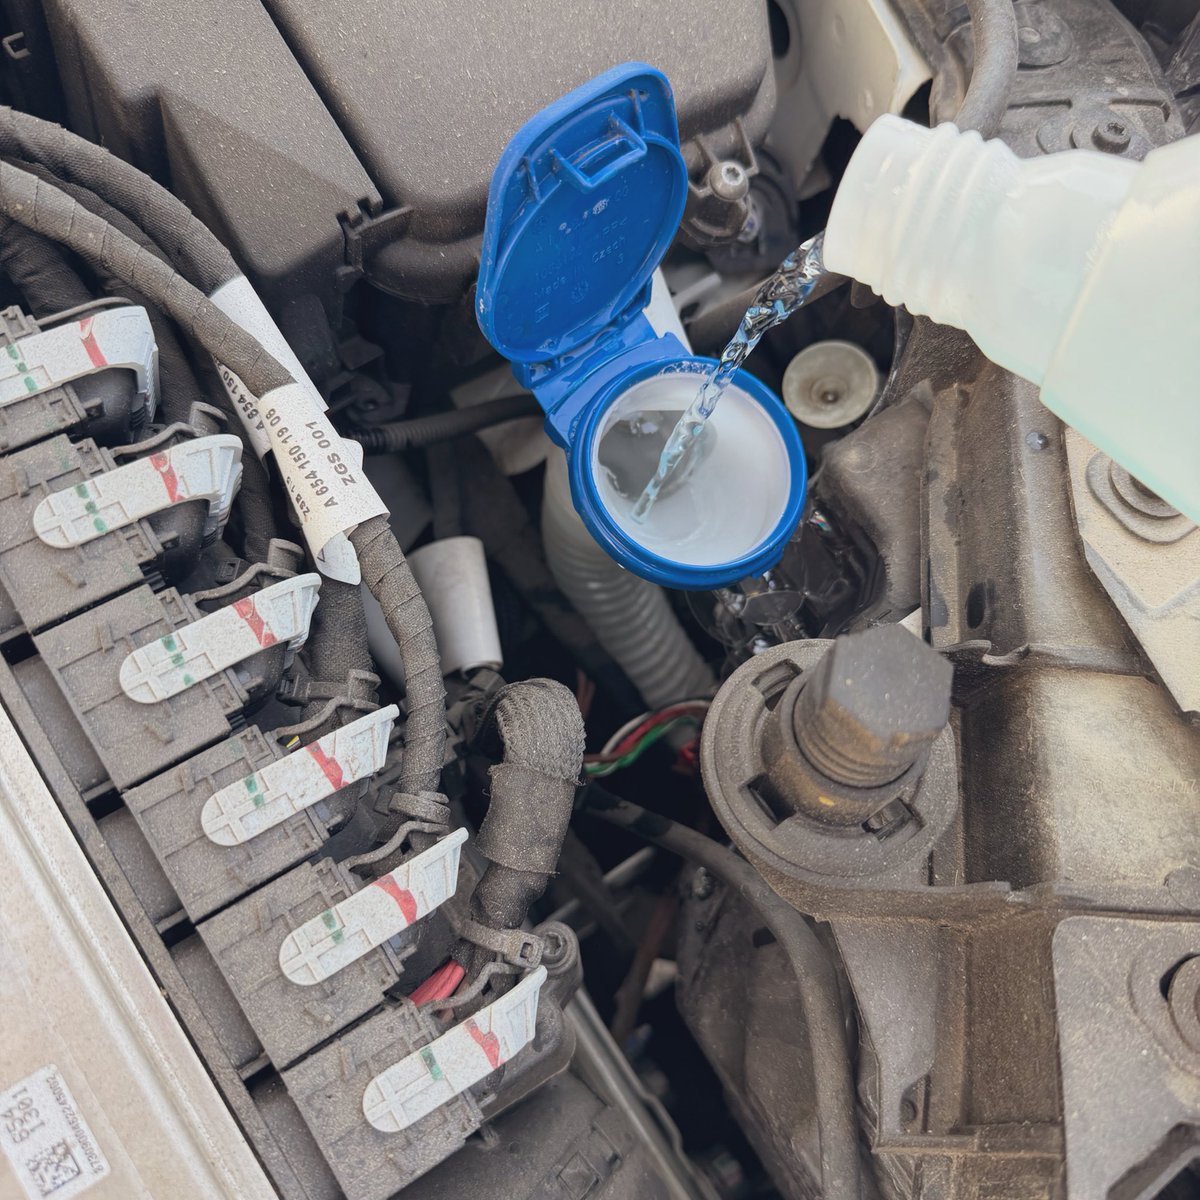
Always keep a ‘car-grade’ washer fluid handy in your Car. 💦
Michelin and Shine-X-Pro are my fav so far if OEM bottle isn’t available.
Thin, does the job alright and strong.
10 ml per 1 Litre (RO or Distilled Water)
My process is simple
Scanning - look for stocks near highs or listed within a year
Just checking which are the themes having the maximum number of stocks to identify the top 3 to 5 themes.
Move the stocks that are immediately buyable to the focus list for the next day.
Prioritize the ones having smaller market capitalization and also from a strong theme.
Buy as the price of my high priority names starts moving up, with day low as my stop loss.
More than this, I don't apply anything else.
One of the biggest advantages of finding stocks in a tight range is that they naturally offer low risk and high reward opportunities. When a stock is moving in a narrow range, your stop loss can stay small while the upside can be significantly larger if the stock breaks out.
In this video, I have explained why tight ranges are so important, how the scan is designed to find them, and how you can use this process to identify better trading opportunities. I'll also walk you through the exact scanning method I use so you can understand what the scan is looking for and why these setups often lead to some of the best risk-reward trades.
For Scanners - Check Description of any of my youtube Video
Qullamaggie on Taking Breaks From Trading, You’re Not Gonna Make It
“And I don’t think these people who feel like they need breaks from trading because they had a few bad days — I don’t think they’ll ever make it. No, I really don’t. I think you know, if you need to take a break as soon as things get tough, you’re never gonna make it, because things get rough like all the time. Everything can be perfect and a few days later you know things are super rough. You just need to get your shit together and not act like a drama queen. It happens — get over it.
And if it gets you more than one night’s sleep to get over it, you know, I think you’re just gonna have a hard time doing this consistently over the long term. That’s my personal opinion — I have no data on it, just my personal opinion.”
💫If you don't have the QElutra indicator. Another reliable way to check the right earning date is this website:
🔗 https://t.co/rm9RHNVi3z
✅Again, repeating: Don't rely on Tradingview to check earnings dates.
🚨 Introducing the XP market breadth score!
XP is a market breadth score that tells the underlying health of the broader market in a single number.
The XP score is an open-source proxy for @stocksgeeks's proprietary EM score, & is now freely available under the Stocksgeeks MBI 2.0 indicator, which you can find here:
https://t.co/EtVr3DQRo5
How to interpret the XP score
XP and EM share the same regime band structure, so the same ranges apply. XP >= 15 is the swing-friendly environment. In practice, the score is most useful around the regime boundaries. e.g. a move from 11 to 13 is more meaningful than a move from 17 to 19, even though both are two-point changes.
Some great earnings reactions this season. And stocks that show strong reactions are always worth tracking in the coming days.
I did a video on Delayed EP setups. Watch it to understand how these structures develop and how strong stocks continue to set up after earnings.
Go through it. You might learn a thing or two.
#Trading #DelayedEP