🚨 How extreme is the move we're witnessing on the S&P 500?
It sits at the 99.7th percentile 📊 — meaning only 0.3% of its entire history has ever printed a higher 18-day return.
📈 +12.28% in 18 calendar days. Out of 20,542 rolling windows since 1928, just 31 comparable events within ±1% tolerance. Filter for moves ≤ current and you're down to ~15.
That's +3.35σ from the mean (μ = +0.44%, σ = 3.53%) ⚡
The kind of print that doesn't show up in quiet bull markets — it clusters around capitulation lows and violent mean-reversion rallies: 1932, 1974, 2009, 2020. 🔁
🔧 We're refining the algorithm to also analyze the average forward returns following these events. Stay tuned. 🔜
$SPX $NDX #SP500 #investing #quanttrading
🚨Alert: the number of #Nasdaq stocks trading above their MA200 fell below 35% today. Historically, about 80% of the times this level was breached, the market was followed by more violent downside moves.
#investing#sp500 $SPX $NDX
@Schuldensuehner I think many are underestimating the current risks. The March 9th bar is the second largest in history in terms of high-low range. Every time such significant bars have appeared historically, the market has always moved higher… Let’s see how it goes this time!
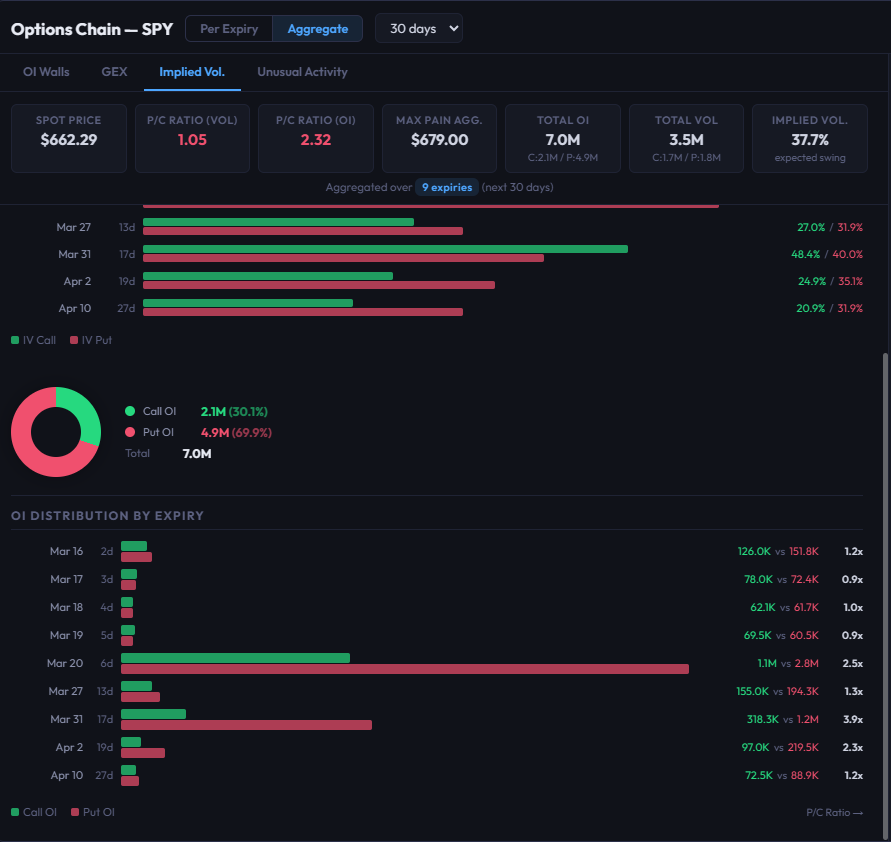
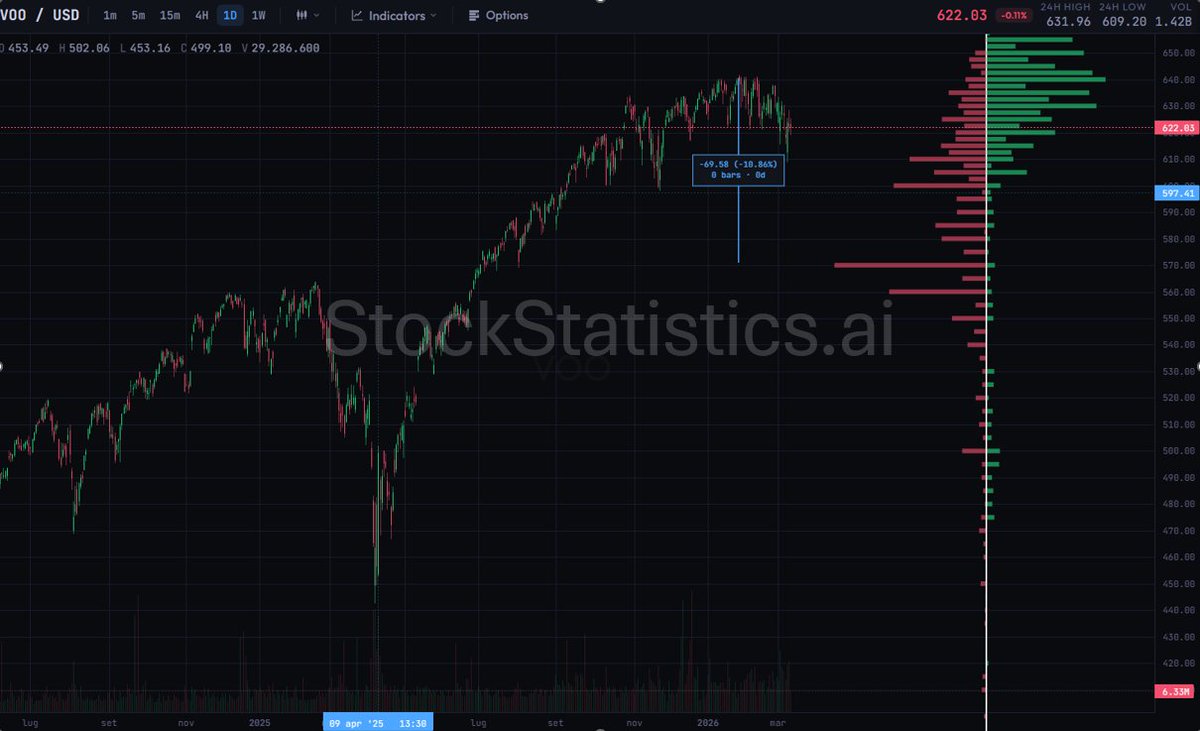
$VOO Options traders are hedging for a 10% drop in the #SP500.
The largest concentration of puts is sitting right at that level.
📊 What you’re seeing here comes from our new dashboard, which tracks aggregated options levels across the coming months.
All the tools investors need in one place:
• 100k global markets
• AI chatbot & AI Insights
• Seasonality & AI Picks Market screener
• Seasonality
• Backtest
• Simulate and backtest a Systematic Investment Plan
• Market Breadth
• Yield Analysis
• Financial Ratios
• Inflation & M2 Adjusted Charts
• Statistical models
• Options positioning
• Cyclical analysis
• Financial statements & fundamentals analysis
• Datafeed
• Financial API Connectors for ChatGPT, Gemini, Claude
Everything integrated into a single platform.
🚀 Launching at the end of March.
Exclusive 50% OFF for our followers!
#FintechNews #finance
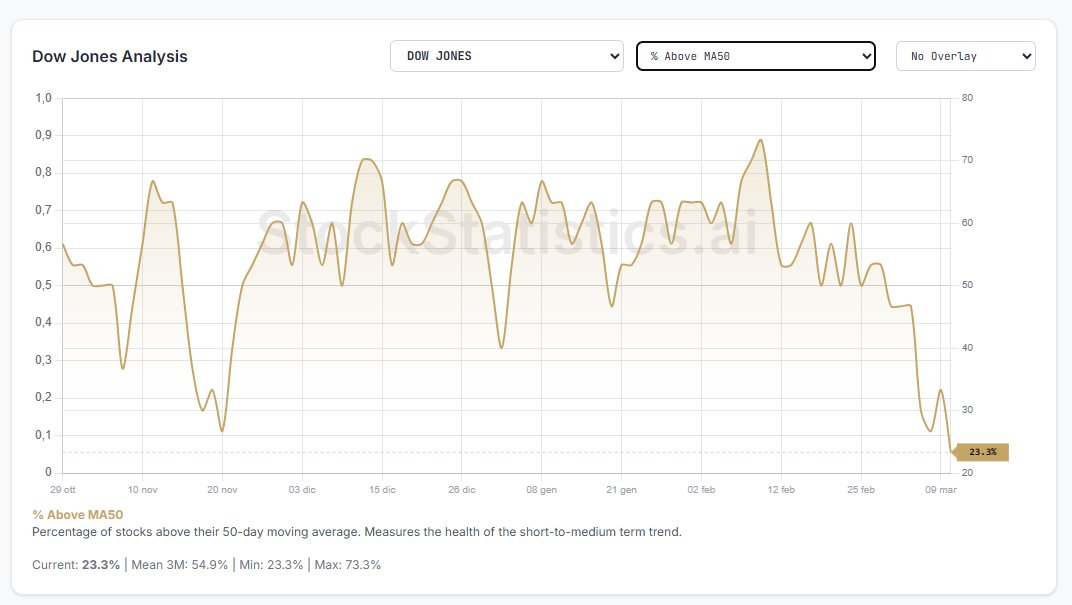
🚨 The Dow Jones is now in its worst market breadth condition of the past year.
📉 Only 23% of its components are trading above their 50-day moving average.
But that’s not the only warning sign.
⚠️ The distance from the MA200 is also near 1-year lows, showing how little upside cushion remains in the index.
Even more concerning:
📊 The average distance of all Dow stocks from their 200-day MA is just +0.1%.
In other words, the entire index is sitting right on its long-term trend, leaving very little margin for error if selling pressure increases.
#stocks #markets #DowJones $DJI $SPY
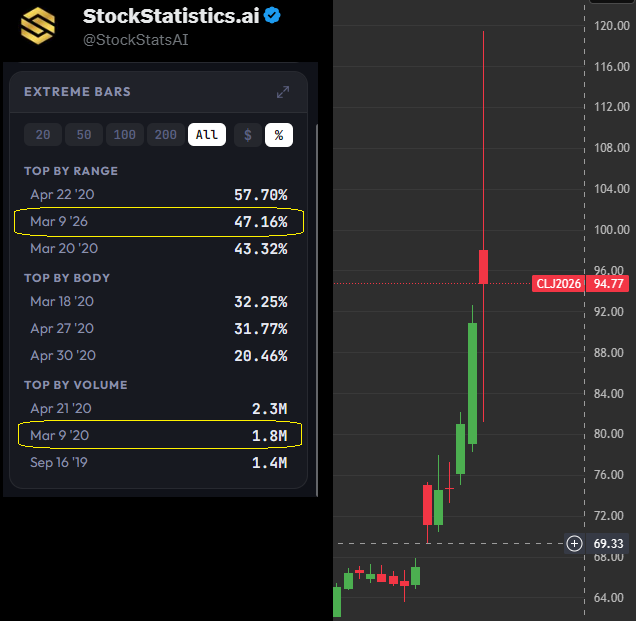
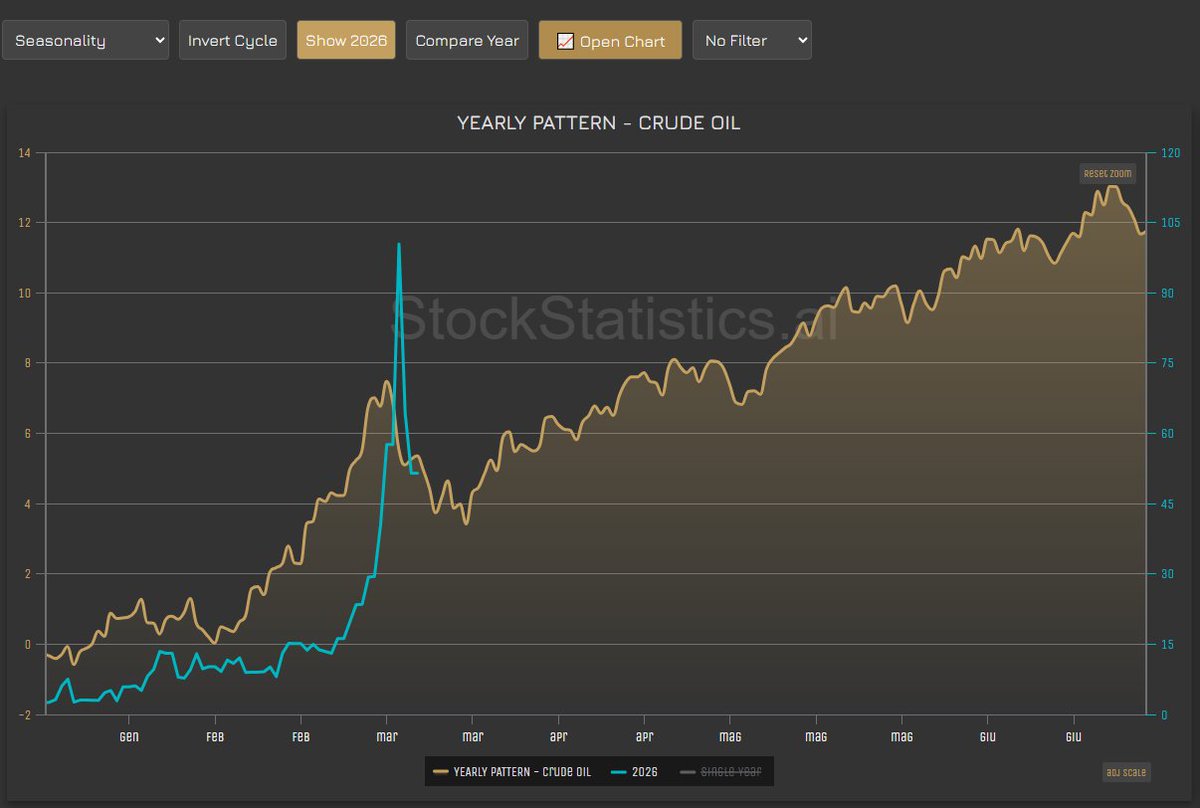
Today's bar on crude oil is the 2nd largest by range in history, only behind April 2020 — the day oil went negative during Covid. 🛢️
$CL #Crude#oil $WTI $USO $XLE
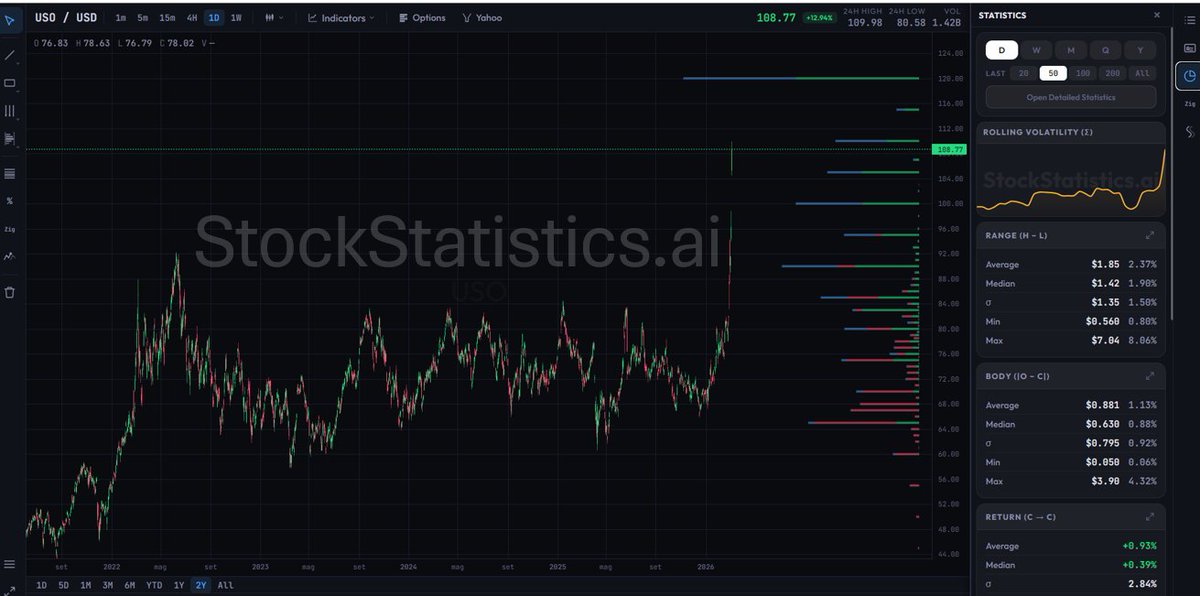
Crude Oil and $USO (United States Oil Fund).
The indicator shows the aggregate call and put contracts for the next 60 days.
Based on the number of contracts, the $120 level could act as the first resistance.
Our new app will be launching soon, and our followers will have the opportunity to try it for free.
It will be one of the most comprehensive trading platforms in the world, featuring a wide range of trading techniques, statistics and metrics.
#OilPrices #OILUSD $OIL $WTI $CL #CrudeOil $XLE