Over time, prices follow earnings. Research from First Trust shows that not only are 2026 earnings expected to grow, all 11 sectors have expected growth. Stay bullish.
While "income inequality" exists, American Enterprise Institute research shows over the last four decades, the largest percent of the middle class is moving UP, not down.
Two different charts from FactSet showing oil shocks back to 1973. The short term (chart 1) looks negative, but when viewed over time (chart 2) seems inconsequential. Stay bullish.
Whenever headlines on Iran/oil recede, worries about debt will retake the narrative. This graph from Ritholtz shows household debt has indeed grown over the last four decades, but assets have grown far faster. Stay bullish.
Iran, oil, government shutdowns, AI fears, a tapped out consumer, etc. - the news is all bad, all the time. But this chart from Macrobond shows worldwide business lending growing. Ignore headlines and stay bullish.
Two charts today - the first from Ritholtz, shows each year's earnings differing from each year's stock prices. The second, from S&P Global, shows how prices follow earnings in the long run...stay bullish.
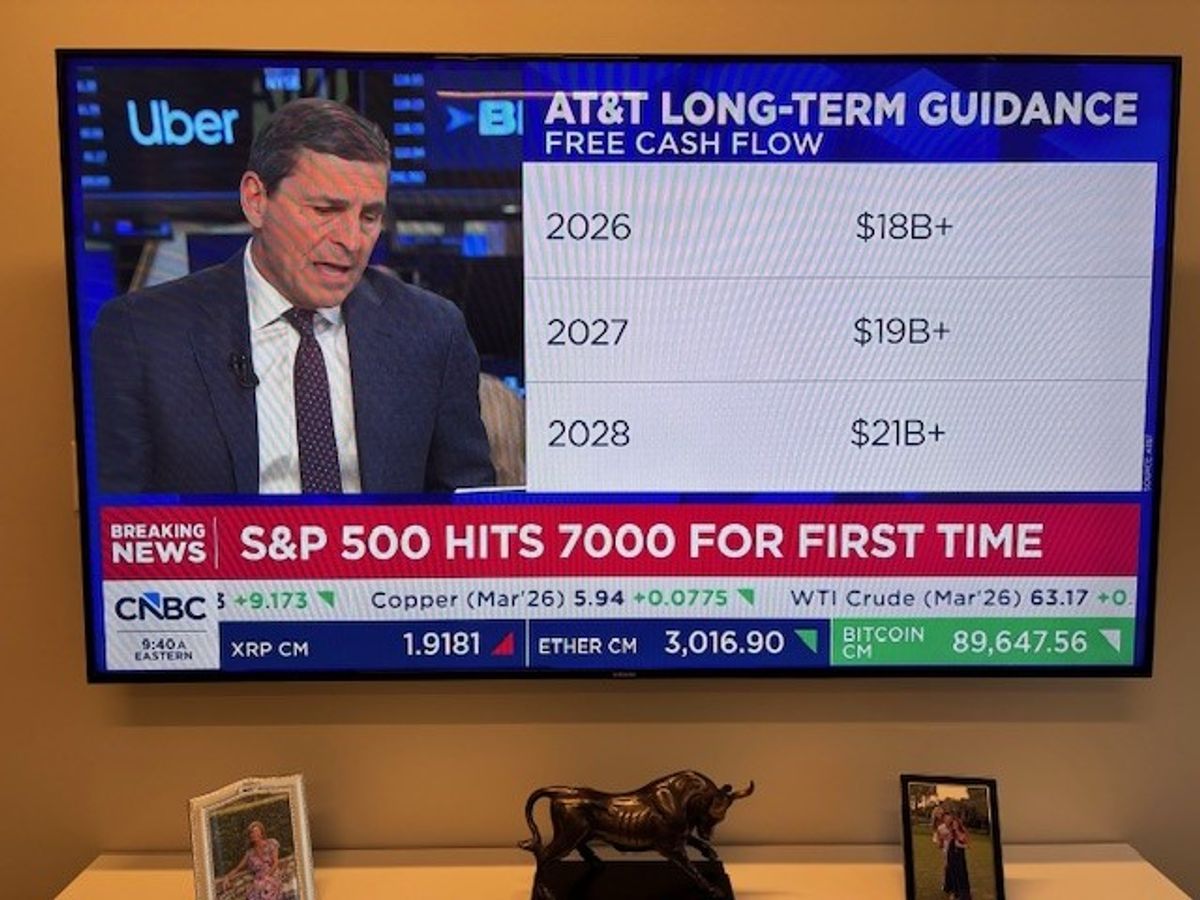
As a newly minted financial advisor, I stood on the floor of the NYSE in 1995, when the S&P 500 closed at 485. that index just hit 7,000...stay bullish.
Data from First Trust shows the incredible growth in space launches last year - 6% of which were by China, and 87% of which were by the U.S. Stay bullish.
This chart from FactSet shows 70 years of stock prices following earnings. Wall Street analysts expect earnings growth of 15% this year and next...stay bullish.
This chart from First Trust shows the expected growth of U.S. natural gas exports through 2032. If this occurs, it will cement America's role as the world's leading supplier. Stay bullish.
This chart from First Trust shows that since 2016, when the U.S. moved beyond only pipeline exports of natural gas to Mexico and Canada, total exports have more than tripled, to over 21 billion cubic feet per day. Stay bullish.
Despite the negative tariff headlines, this IMF chart shows sustained global growth this year and next. And, the World Trade Organization says global merchandise trade volume will grow 2.4% this year, up from its earlier prediction of 0.9%. Stay bullish.
The popular news narrative is growing income inequality, which is true, but the fact that's overlooked is more Americans are moving UP from the middle class than down, as this chart from Bloomberg shows. Stay bullish.
This chart from FactSet shows mortgage rates near the lowest in 3 years. With more rates cuts likely coming soon - this is good news for the housing market. Stay bullish.
With gold at all time highs - is it a good idea? The Standard & Poor's chart below shows 45 years of gold compared to stocks...it's not even close. Stay bullish.