We've been quiet for a month.
Building our new flagship: https://t.co/G8Z5Ffd9F3 |Suite 🚀
✅ One single engine
✅ One core logic
✅ Multiple preset configurations, each refined for a specific asset and timeframe.
📊 Base All Assets 1D — universal baseline
🎯 Base BTC 1D — our star preset for Bitcoin
+ ETH, SOL, SUI, TSLA presets
No more switching between strategies.
No more manual tuning.
Load → select your preset → done.
We don't predict, we react!
Overtrading kills accounts faster than bad trades.
A system that knows when NOT to enter is just as valuable as one that knows when to enter.
That's what https://t.co/EJi3rpFJF2 Suite does.
We don't predict, we react!
→ https://t.co/qQa7zEiAsj
The hardest trade in a bear market?
Doing nothing.
As the chart shows, EVOL stayed in cash and avoided the last two potential entries while Bitcoin kept falling.
Most traders are addicted to action.
The market doesn’t pay you for activity.
It pays you for discipline.
Sometimes cash is the position.
Sometimes the best trade is no trade at all.
#Bitcoin #BTC #Trading
Free tool we shipped:
Cross-Market Correlation scans any asset pair across 6 time horizons + 365 days of offset.
Use case: finding non-obvious lead/lag relationships.
Example: DXY leads BTC by ~218 days at +0.61.
Search "Cross-Market Correlation" on TradingView.
Bitcoin's strongest macro correlation isn't M2 anymore.
It's IGV.
We built a free TradingView indicator that tests BTC against any asset across 6 time horizons and 365 lag offsets.
Among IGV, DXY, GOLD, QQQ, SPX, NVDA — IGV came out on top at +0.89.
Maybe Bitcoin never stopped trading as a liquidity asset.
Maybe we were just watching the wrong proxy.
Full breakdown: https://t.co/9LlJqte0zT
The truth?
Most traders skip these filters because nobody taught them.
That's exactly why we built https://t.co/G8Z5Ffd9F3 Suite — with a HUD that shows every KPI instantly.
No guessing.
No pretty lines.
Just numbers you can defend.
We don't predict, we react!
→ https://t.co/NiknAfoJ92
📩 Reply "GUIDE" and I'll DM you our 1-page checklist on how to evaluate any TradingView strategy in 60 seconds.
(Follow to allow DMs)
Filter #2 — Are the KPIs solid?
Even with a Strategy Report, most show:
❌ <50% win rate
❌ Profit Factor below 2
❌ Max Drawdown over 50%
Real systems show:
✅ 70%+ win rate
✅ Profit Factor above 3
✅ Max Drawdown under 15%
3 numbers every backtest should show:
1️⃣ Max Drawdown — the worst pain you'd endure
2️⃣ Profit Factor — for every $1 lost, how much earned
3️⃣ Trade count — is it statistically meaningful, or 3 lucky trades?
Without these, "X% return" means nothing.
Always demand the full picture. 📊
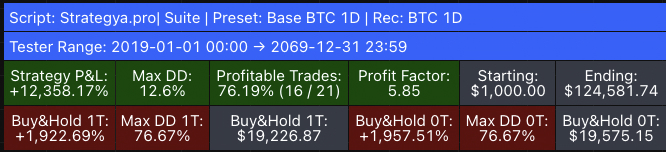
Base BTC 1D — 7 years of testing on Bitcoin daily
📊 +12,358% return
🛡️ 12.6% max drawdown
🎯 76.19% win rate
⚡ 21 trades total
Buy & Hold same period: -76.67% drawdown.
That's the difference between predicting the market and reacting to it.
The Suite gives you both:
✅ Versatility — Base All Assets
✅ Precision — asset-specific presets
Load → select preset → done.
No code. No manual tuning.
Full breakdown in our intro video.
We don't predict, we react!
Most "trading strategies" online have one fatal flaw.
They look great on the asset they were designed for.
Test them on anything else → they fall apart.
That's why we built https://t.co/EJi3rpFJF2 Suite around one engine, with presets refined per asset.
🧵👇
Why does this matter?
Because Bitcoin moves differently than Ethereum.
Ethereum moves differently than Solana.
Stocks move differently than crypto.
A single "one-size-fits-all" strategy can't capture that.
Precision beats generalization. Always.
We've been quiet for a month.
Building our new flagship: https://t.co/G8Z5Ffd9F3 |Suite 🚀
✅ One single engine
✅ One core logic
✅ Multiple preset configurations, each refined for a specific asset and timeframe.
📊 Base All Assets 1D — universal baseline
🎯 Base BTC 1D — our star preset for Bitcoin
+ ETH, SOL, SUI, TSLA presets
No more switching between strategies.
No more manual tuning.
Load → select your preset → done.
We don't predict, we react!
Oct 2025: Black Swan event hit the market. 🦢
The algorithm exited again. Same discipline.
Two crashes.
Two exits.
Zero panic.
🛡️ 12.07% max drawdown while Buy & Hold suffered 76.67%
💰 $1,000 became $124,706
This is not prediction.
This is execution based on data.
𝐂𝐨𝐧𝐬𝐞𝐫𝐯𝐚𝐭𝐢𝐯𝐞. 𝐃𝐢𝐬𝐜𝐢𝐩𝐥𝐢𝐧𝐞𝐝. 𝐁𝐮𝐢𝐥𝐭 𝐟𝐨𝐫 𝐁𝐢𝐭𝐜𝐨𝐢𝐧.
https://t.co/xY53yKgV5o
#Bitcoin #BTC #AlgoTrading #TradingView #Crypto #TradingStrategy
Meet our flagship: 𝐁𝐀𝐒𝐄 𝐁𝐓𝐂 𝟣𝐃
Backtested Jan 2019 → Mar 2026:
📊 +12,370% vs +1,713% Buy & Hold
🛡️ Max Drawdown: 12.07% vs 76.67%
🎯 76.19% win rate | 16/21 trades
⚡ Profit Factor: 5.88
💰 $1,000 → $124,706
Look at the chart.
The numbers speak for themselves 👇
Nov 2021: BTC topped at $69K.
The algorithm exited. Full cash. ✅
What followed?
🚩 -76% crash
🚩 406 days of blood
🚩 Most traders wiped out
𝐎𝐮𝐫 𝐞𝐪𝐮𝐢𝐭𝐲 𝐜𝐮𝐫𝐯𝐞? 𝐅𝐥𝐚𝐭. Completely flat.
No exposure = no drawdown.
Feb 2023: the system re-entered. Captured the entire new cycle.
While most bought the top and sold the bottom, BASE BTC 1D simply waited. 👀