I know for many, after a long week of trading, it takes real motivation to sit down and analyse it all.
If you’ve done well, you might tell yourself “why bother?”.
If you’ve done badly, you might think: “I can’t bear re-living all my mistakes, I’ll just try harder next week” without any solid plan of exactly what you’re going to work on and importantly, how to improve on it.
You have to fight these thoughts to consistently elevate performance.
I’ve tweeted this review process many times. Remember: curiosity is the foundation for improvement.
Honestly speaking
Strategy Creation - 50 examples of it working - back tested - annotate the charts, the fundamentals - when it works and what the volume exhibited vs didnt - when does it fail.
Forward testing - live trading - Annotate the chart - where you executed and why - what happened - what could you have done better - where did you fuck up - what did you do well - how it played out - do this for 20+ trades and refine any +EV / Edge...
Have you improved?
If Yes then Size up on A+ setups - should be clear by now what they are
If No - then figure out why...
Annotate annotate annotate... most wont do it though
Save in relevant folder in evernote / one note - under the strategy name followed by date.
That for me has been the most impactful aspect besides having all the other foundations in place.
I no longer use a workflow of my process anymore - but I have a workflow of my process including the rules around a trade setup and I've simplified it since.
When executing a trade the focus is fully on the chart / technical / orderflow - not on some workflow chart ticking off each box, id find it a distraction - but it does have real value in helping create structure / foundation especially for those figuring out a strategy / adding to a playbook.
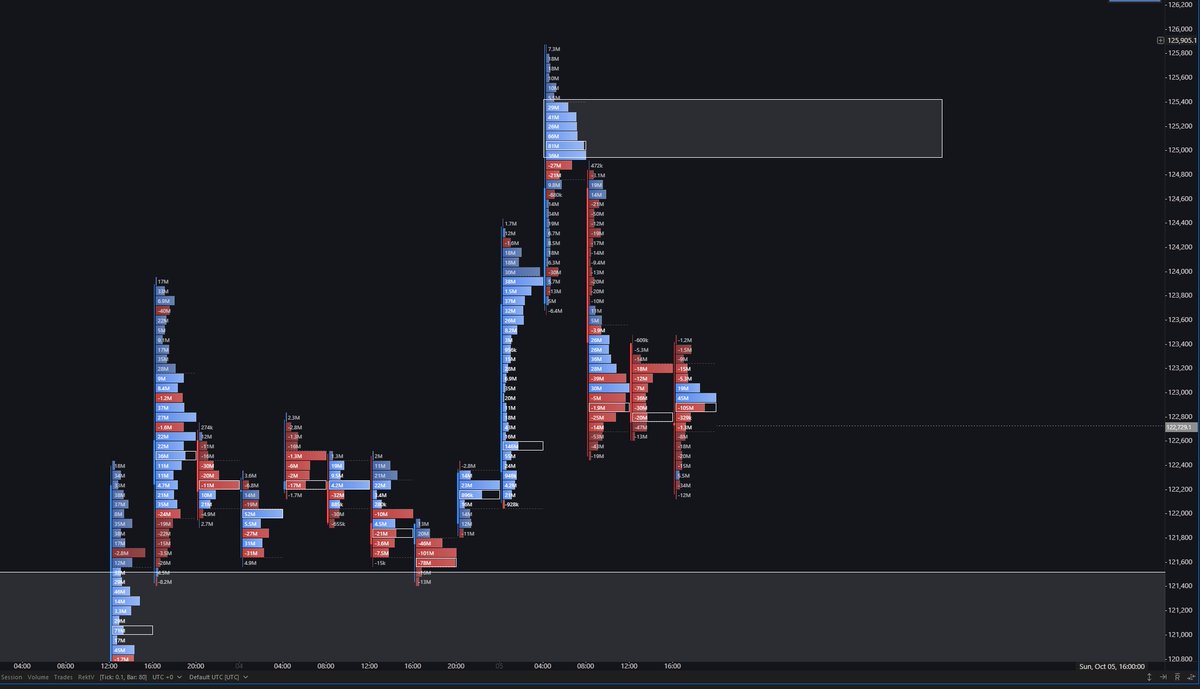
When fading range extremes, you want:
Volume tapering at the tails -> signals exhaustion and lack of follow through (often a result of positioning forced to close out with no follow through)
Acceptance below local HVN -> confirms rejection of the extreme and rotation back toward balance.
Acceptance holding below the HVN → shows the fade is sticking and the auction has shifted back inside value.
Retest and rejection of thin areas LVNs add further weight to the setup...
There is context and structure within a developing profile that you can refine your execution...
Takes time and practice but patterns repeat.
125 was a sell for me... which I have
Why a high win rate isnt the holy grail?
Ok nothing new here but just sharing from my own experience:
In 2018, when I first started trading with leverage, I made the same mistake many new traders make, which is ultimately trying to chase a high win rate and if it wasnt a high win rate, it wasnt good enough.
A few losses would throw me off my process leading to over-leveraging, adjust entries on the fly, taking unplanned trades or skipping planned trades - just to name a few.
What's key to understand is that profitability isn’t about avoiding losses. It’s about expectancy.
Consider a simple model:
Account size: $100,000
Risk per trade: 1% ($1,000)
Win rate: 45% (45 wins, 55 losses)
Reward/Risk: +2R on wins, -1R on losses
Outcome after 100 trades: $135,000 (+35%)
Expectancy: +0.35R per trade
Even with a win rate below 50%, this system has positive expectancy, carries edge, and produces profits.
It isn’t flawless, yet there is so much room for improvement with a focus on trade selection, timing, and risk allocation, applying a better filter to select A+ trades and sizing up on them.
But the foundation is solid. Journaling and reviewing are what transform a basic edge into a sharper, more consistent one over time.
The math is simple. The real challenge is staying the course long enough to let it play out.
Most aspiring traders never make it to 100 trades because they are rattled by variance, size up too quickly, or abandon their process after a drawdown and eventually blow up, been there and done it many times in 2018-2019.
I would get to around 30-40 trades before taking a huge loss (-50% drawdown or completely blowing out) - hence of my "trading goals" was just to make it through to 100 trades, amongst many goals at that time.
The true edge isn’t just in the numbers, it’s in the discipline to stick to the process and the patience to refine it (the real work away from staring at the screen all day). That’s what separates compounding from blowing up.
Its a tough game to crack, let the numbers show you the way. Dont think about the end goal but the process that will help you get there.
Momentum based trading:
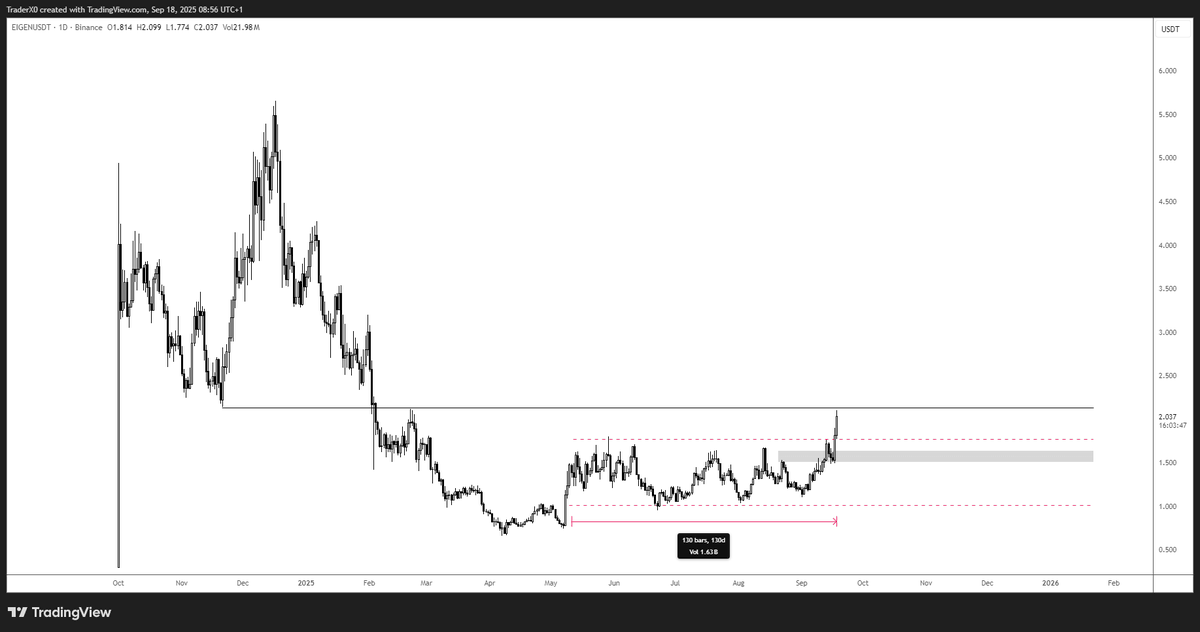
Very good structural setups forming across a number of alts, multi-month ranges and bases now well established.
If conditions remain favorable into Q4, the focus will be on momentum trades.
When these markets move, they trend fast and that’s where a well-designed set of filters and scanners becomes invaluable for catching the moves early.
Filter examples:
1. Structural & Technical Filters
Scan for alts that have spent 3+ months consolidating in tight ranges with compressed volatility, now breaking above multi-week/month highs on expanding ATR, while holding above rising 20/50 EMAs stacked bullishly.
2. Momentum & Volume Filters
Scan for alts showing relative strength vs BTC/ETH, breaking out on 2–3x their 20-day average volume, good daily liquidity (e.g. $10M+), rising spot/perp turnover that signals real demand, and expanding ATR confirming momentum.
3. Sector rotations
Fairly obvious
Many complain about the lack of activity on alts but theres always opportunity, you need a good filter / scanner that cuts through the noise and flags the best potential momentum based setups on your screen, for which you should have a strategy and know how to structure the trade.
Most traders plateau after their first winning streak.
But the difference between good and great isn’t ideas, it’s just how you run risk.
Part 3 of Zero to Stock Hero is live
(and free)
https://t.co/JDaP3NnVA9
Every System Sucks
Social media trading glorifies perfect win rate systems with 0 drawdown entries that go straight to target.
Gurus don't talk about their losing trades or losing streaks to maintain the fantasy that you can consistently risk and win without losing.
This brainwashes their less experienced followers into believing they're doing something 'wrong' if they lose a trade (or multiple trades) and sends them on a goose chase for a mythical trading system that never loses money.
It doesn't exist.
If you trade, you're going to lose money at some point.
Every edge or profitable trading system either decays over time or gets washed out completely by a change in the market regime.
Trends end and have false starts. Trend followers get chopped.
Breakouts fail. Momentum traders get trapped.
Means stop reverting. Mean reverters get steamrolled.
That doesn't mean the system is inherently flawed.
It's just the cost of doing business.
The point of risk management is to allow you to absorb those unavoidable losses and stay in the game.
That's why it's called risk management, not risk avoidance.
If you want to avoid losing trades, there's an easy way to do it: don't trade.
Otherwise, you need to be comfortable with the fact that even the best trading system will eventually serve you losing trades.
This is precisely why traders obsess over position sizing: the goal is to maximise your edge while it's there/the regime is supportive, without losing your shirt once it decays or disappears entirely.
Crucially, if your previously profitable trading system starts losing, that can be an early warning signal that the underlying regime is changing.
Losing streak on a trend following system that was printing? The market may be consolidating.
Breakout trades turn into traps? The market may be running out of steam.
Mean reversion trades overshooting their expected ranges? Volatility expansion may be underway.
These are critical insights, but you can only meaningfully gain access to them if you're willing to stick to your system, learn its nuances, gather data, and take risk instead of panicking and abandoning ship after the first losing trade.
To summarise:
1. Losses are inevitable. Every trading system experiences losing trades. They are the cost of doing business, not proof of a flawed system.
2. Risk management is not risk avoidance. The goal is to size such that losses don’t knock you out, not to eliminate losses entirely.
3. Edges decay. Market regimes shift, so a once profitable strategy may stop working and losses can be an early signal of change.
4. Stay disciplined & collect data. By sticking to your system through different regimes and by stomaching variance, you can learn its behaviour and spot regime shifts early.
5. There's no free lunch.
Looking at this 10-Year Breakeven Inflation Rate chart arguably the Fed's 2nd most watched indicator after unemployment and it tells a remarkable story of success in re-anchoring inflation expectations.
At 2.42% today, this metric shows markets believe the Fed will average ~2.4% inflation over the next decade.
Why does this matter so much? Because inflation expectations are self-fulfilling. If everyone expects 5% inflation, they'll demand 5% wage increases and set 5% price hikes, creating exactly that inflation. But if expectations stay "anchored" near the Fed's 2% target, it makes their job infinitely easier.
BREAKING: MIT scientists prove "Male Pattern Baldness" is a $3.5 billion LIE
It's not genetic. It's not hormonal
It's MITOCHONDRIAL - your scalp is aging 6x faster than your skin
Big Pharma has been hiding the truth for 40 years
And we have the RECEIPTS
🧵
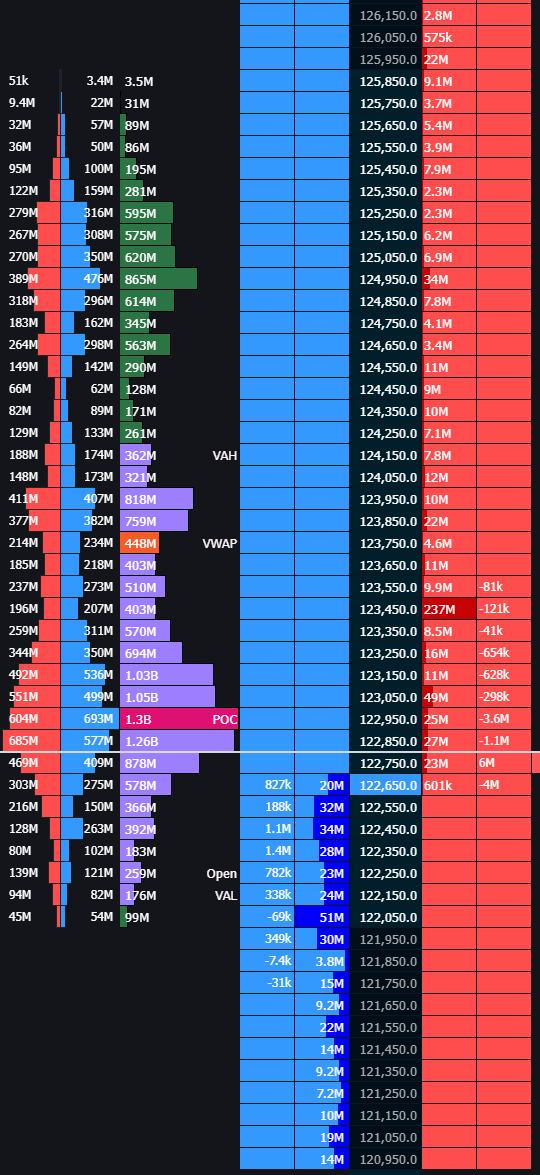
Auction Context – Market Profile as Your Map
Before you think about placing a trade, you want to know where in the auction cycle the market is.
Market Profile gives you the structure that most traders don’t see when they’re staring at candlesticks.
5 Core Concepts to Track:
1. Value Area High (VAH) / Value Area Low (VAL)
Defines the 70% of the session’s volume where most business was done.
Outside of value = “expensive” or “cheap” to the market participants.
2. Point of Control (POC)
Price with the most activity = a magnet in balance conditions.
3. Main Day Type Recognition (there are others)
3.1 Balanced -> Mean reversion more likely.
3.2Trend Day -> Initiative activity dominates which means profile elongates in one direction.
3.3 Double Distribution → Two distinct value zones; mid-point acts as a pivot.
4. Structural References
Single prints, low-volume nodes (LVNs) and (HVNs), poor highs/lows, unfinished auctions, each can act as magnets or barriers.
5. Why this matters:
Knowing the auction context lets you pre-define where business is likely to occur and where rejections are probable = which stops you from chasing every micro move.
NOW ONTO GAME PLAN:
Auction context feeds into your game plan.
You’re answering the following:
“Am I a buyer, seller, or observer today?”
“Where is my line in the sand?”
Premarket Prep Routine:
- Mark prior session VAH, VAL, POC.
- Mark overnight high/low and see how they relate to prior value.
- Note anomalies (e.g., single prints) that could be filled.
Decide if you’re looking for:
Initiative trades (price driving away from value) ?
Responsive trades (price returning to value) ?
Bias Examples:
Open above VAH + holding → Look for longs if order flow supports continuation.
Open inside prior value → Fade moves to VAH or VAL unless initiative order flow breaks out.
Mindset:
You should be able to write your bias in one sentence before the open. If you can’t, you’re not ready to trade.
Anyway just my 1 cent whilst Im watching a trade develop - cheers
The undisputed Quote King of Fintwit is none other than @Trader_Dante.
With over a quarter century of skin in the game he certainly knows a thing or two.
Check out these top 10 quotes from the “ledge” himself 🧵👇
How to Read Positioning (Correctly)
New video covering how I read market positioning, often a very misunderstood concept.
I show how delta + price is often misread for positioning.
Hopefully you find this useful.
⤷ https://t.co/MgMv4YegbH
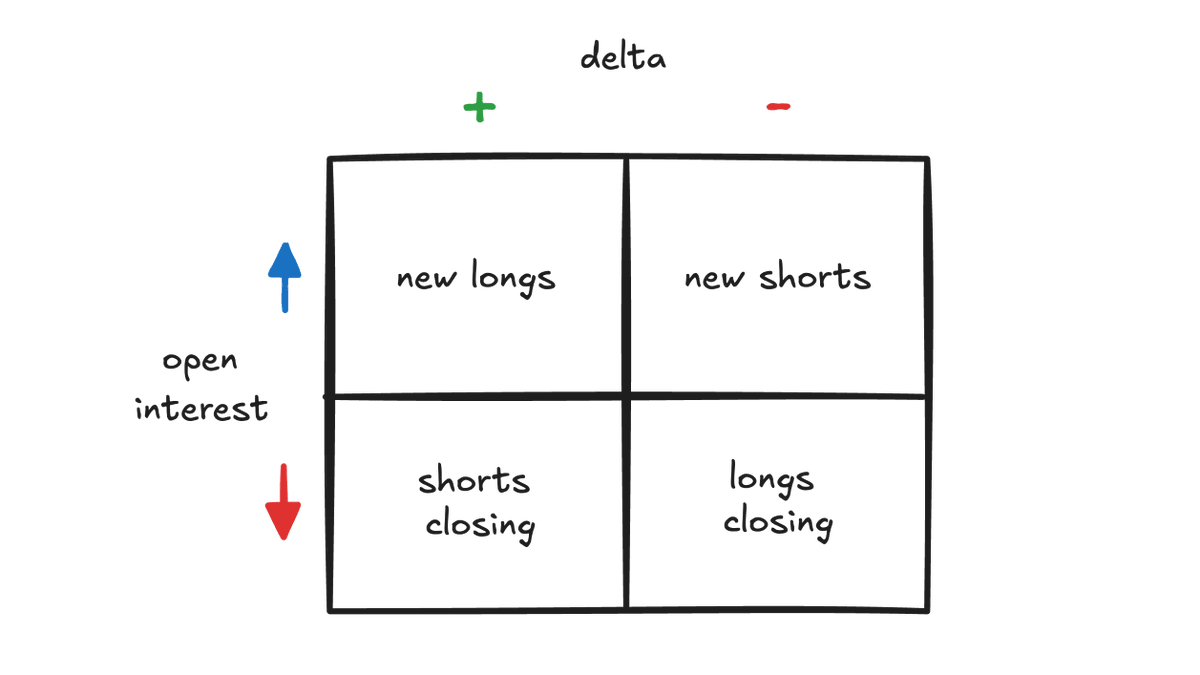
delta + price:
is the wrong way to measure positioning.
all you know is the side on which the aggressor (market) is acting.
focus on: price + delta + open interest
- direction (price)
- side (delta)
- money in/out (open interest)
examples ↓