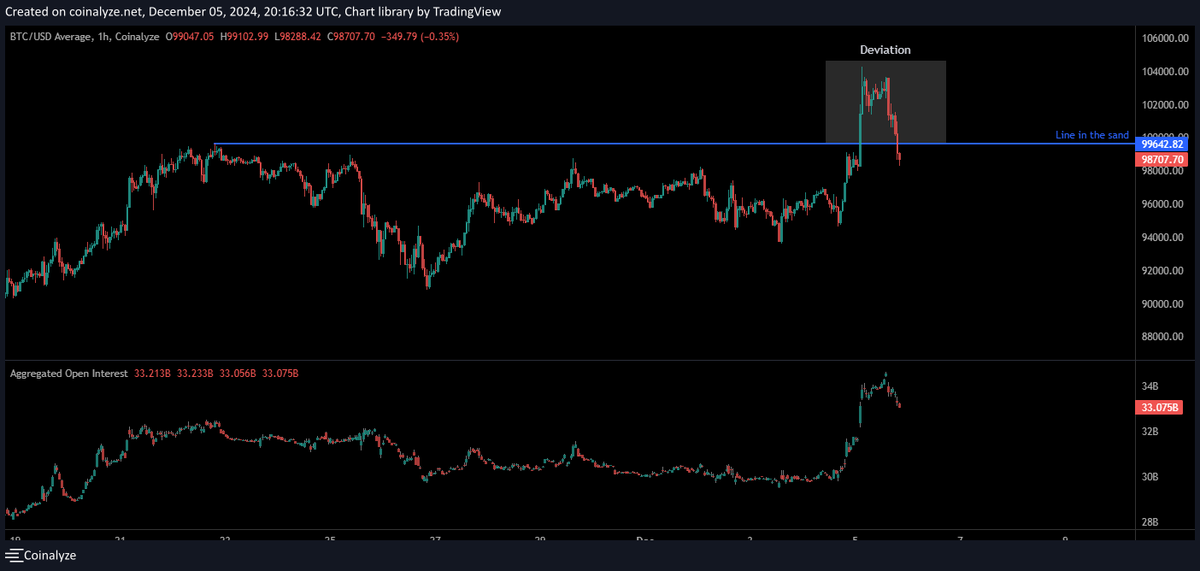
Glad I SOLD ALL OF MY CRYPTO at 99k.
NO I'm not "back" yet...
I'm Lurking In the shadows until it's time.
The BOTTOM is FAR from being in on Bitcoin.
That's a promise.
Some people unfollowed after my post.
That’s okay — truth often clears the room.
I didn’t post to gloat.
I posted because I care about timing.
I sold at the top because I watched.
I’m silent now because it’s not time yet.
When it is... I’ll be loud again.
Glad I SOLD ALL OF MY CRYPTO at 99k.
NO I'm not "back" yet...
I'm Lurking In the shadows until it's time.
The BOTTOM is FAR from being in on Bitcoin.
That's a promise.
Alpha.
Open a fresh #BTC chart via tradingview.
1week or 1day timeframes
Add anchored VWAP from the previous local range/impulse low
Add Anchored VPR from the beginning of the active trading range
Go to coinglass and study the Liquidation heatmap (Symbol- model1 -12Hr/1week)
Now the last thing you need is to view and understand moneyflow and momentum.
Add a moneyflow tool
Add a momentum tool
(I use marketcipher) but there are many others available.
Literally go with the flow....
You're welcome 🚬
Ask me anything and I'll try my best to answer.
Alpha.
Open a fresh #BTC chart via tradingview.
1week or 1day timeframes
Add anchored VWAP from the previous local range/impulse low
Add Anchored VPR from the beginning of the active trading range
Go to coinglass and study the Liquidation heatmap (Symbol- model1 -12Hr/1week)
On your chart, map out the following:
AVWAP with solid line.
AVPR Value high, point of control, and value low, all with dotted lines.
Now use the coinglass liquidation heatmap to view where the biggest liquidity pools are.
Add boxes to each liquidity pool range on your chart.