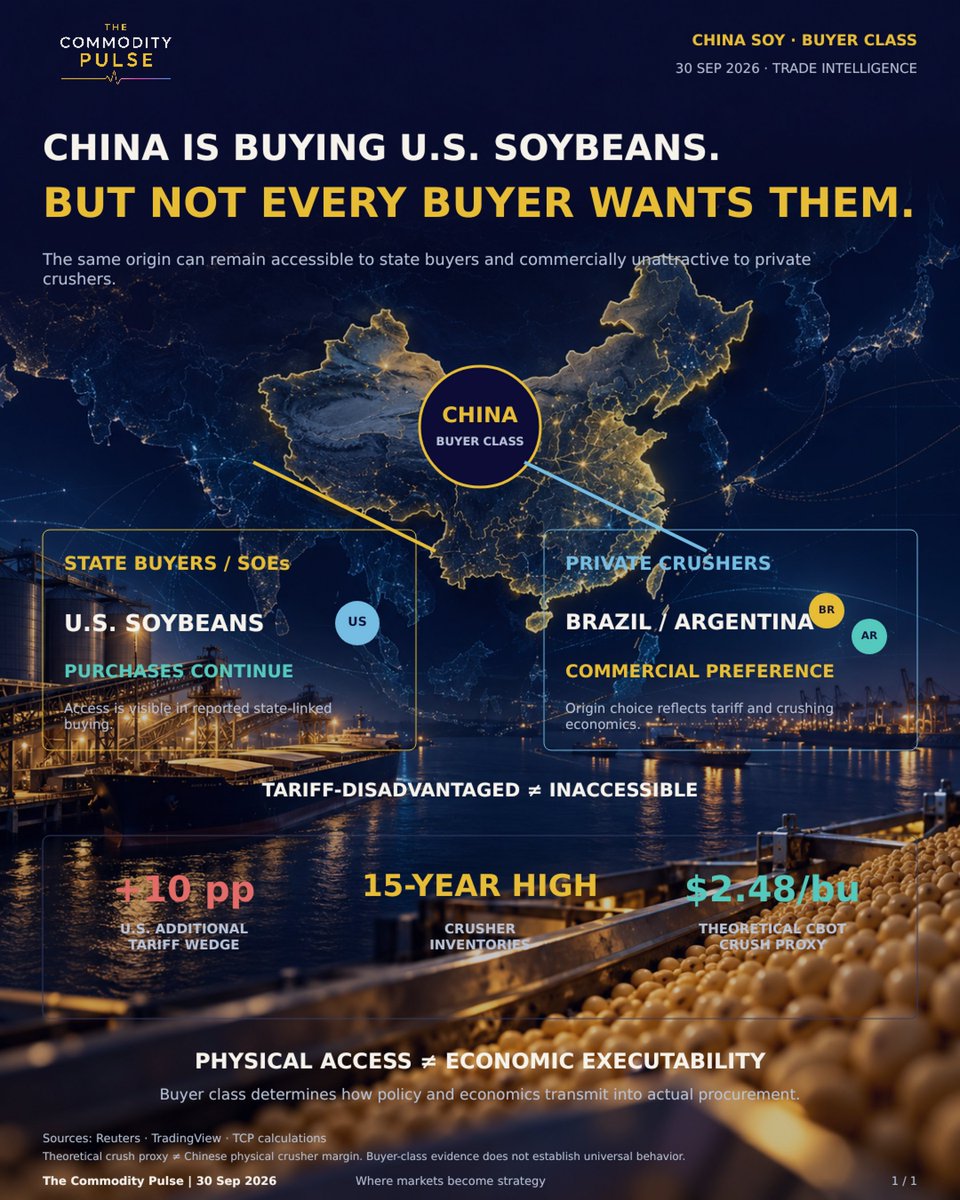
China is buying U.S. soybeans. But not every buyer wants them.
SOEs keep buying U.S. beans; private crushers favor South America.
Same market. Different economics.
Physical access ≠ economic executability.
The Commodity Pulse
Where markets become strategy
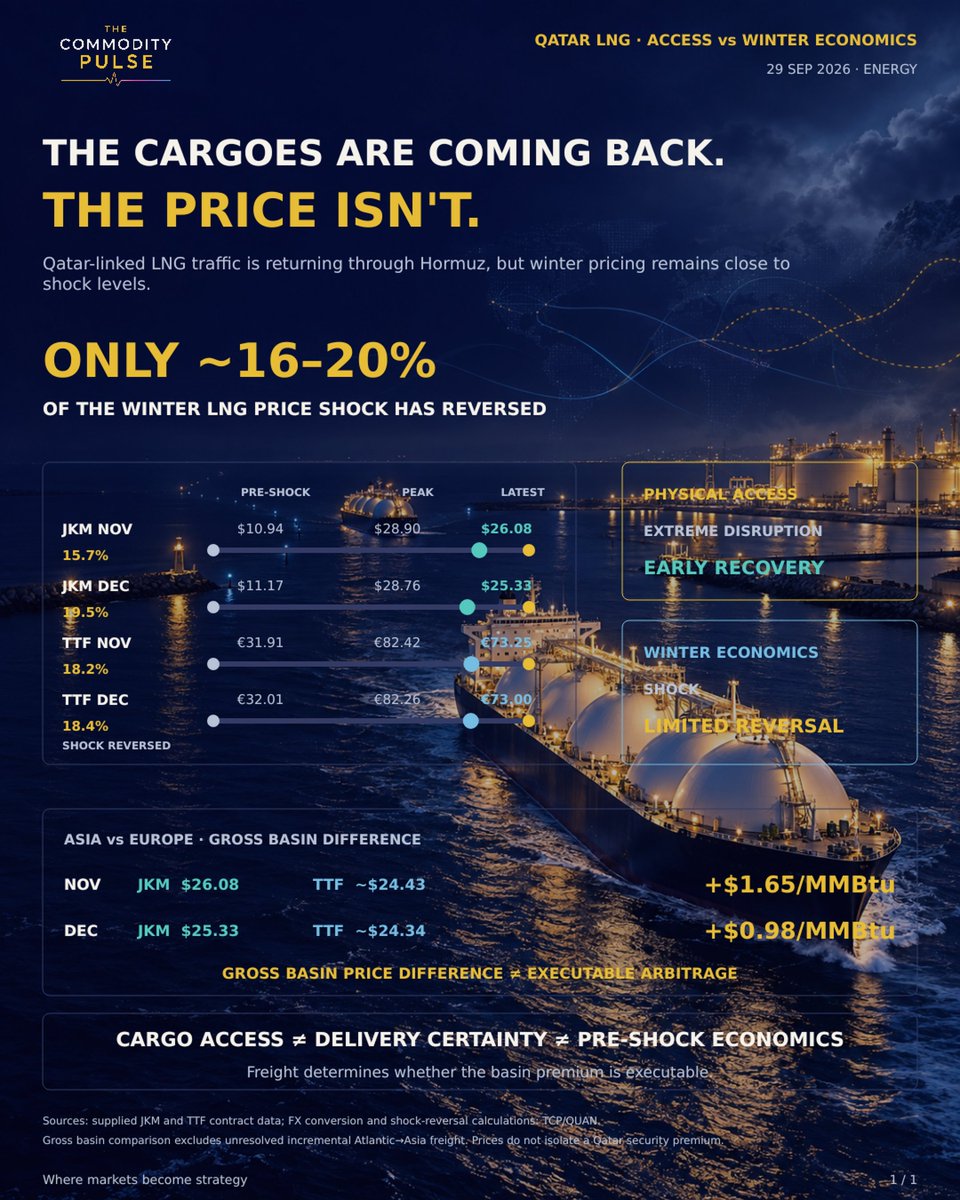
The cargoes are coming back. The price isn't.
Qatar LNG access is recovering, but only ~16–20% of the winter JKM/TTF price shock has reversed.
Physical access ≠ economic normalization.
The Commodity Pulse
Where markets become strategy
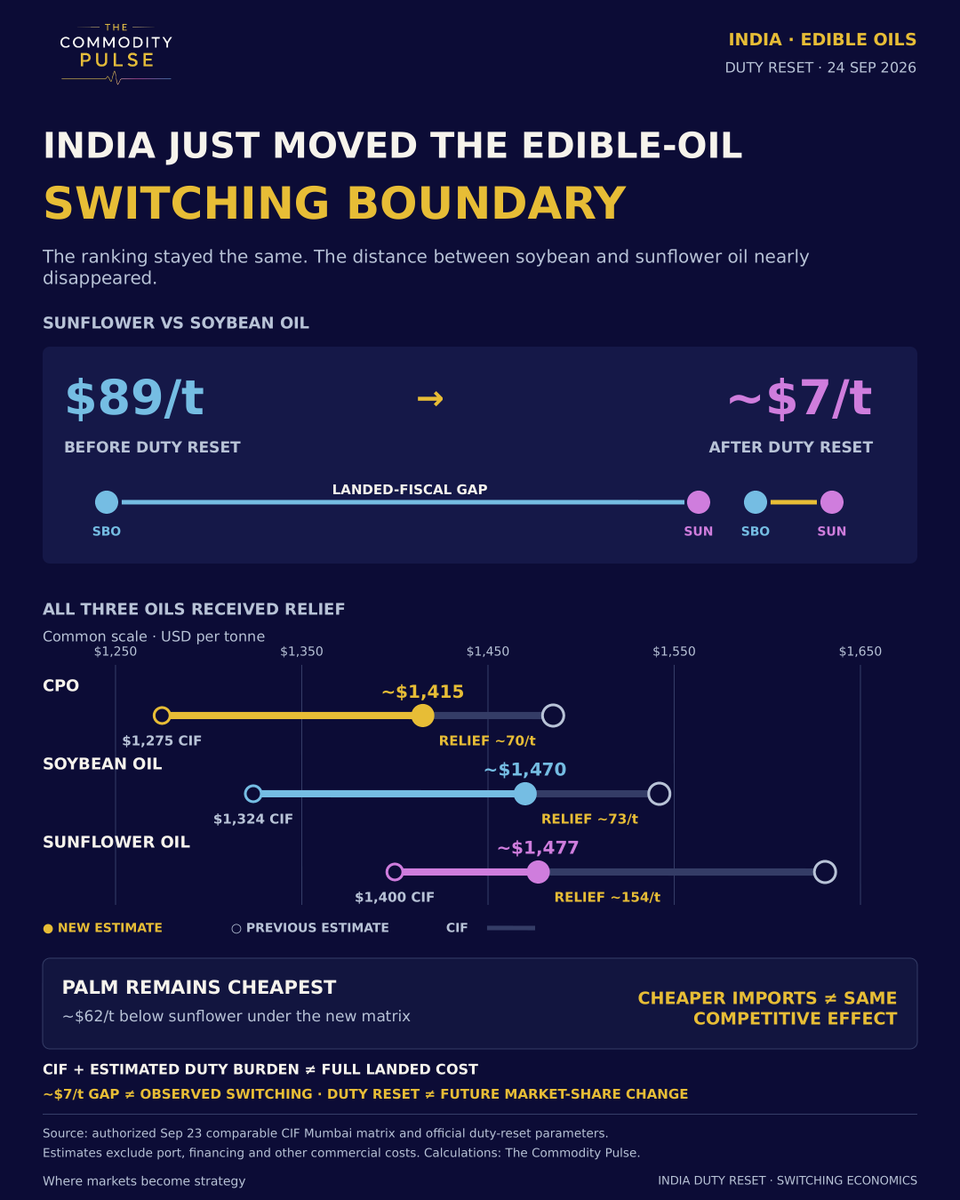
India moved the edible-oil switching boundary.
Sunflower's estimated landed-fiscal gap vs SBO:
~$89/t → ~$7/t.
Palm remains cheaper. No switching proven yet.
Policy changed the economics.
The Commodity Pulse
Where markets become strategy
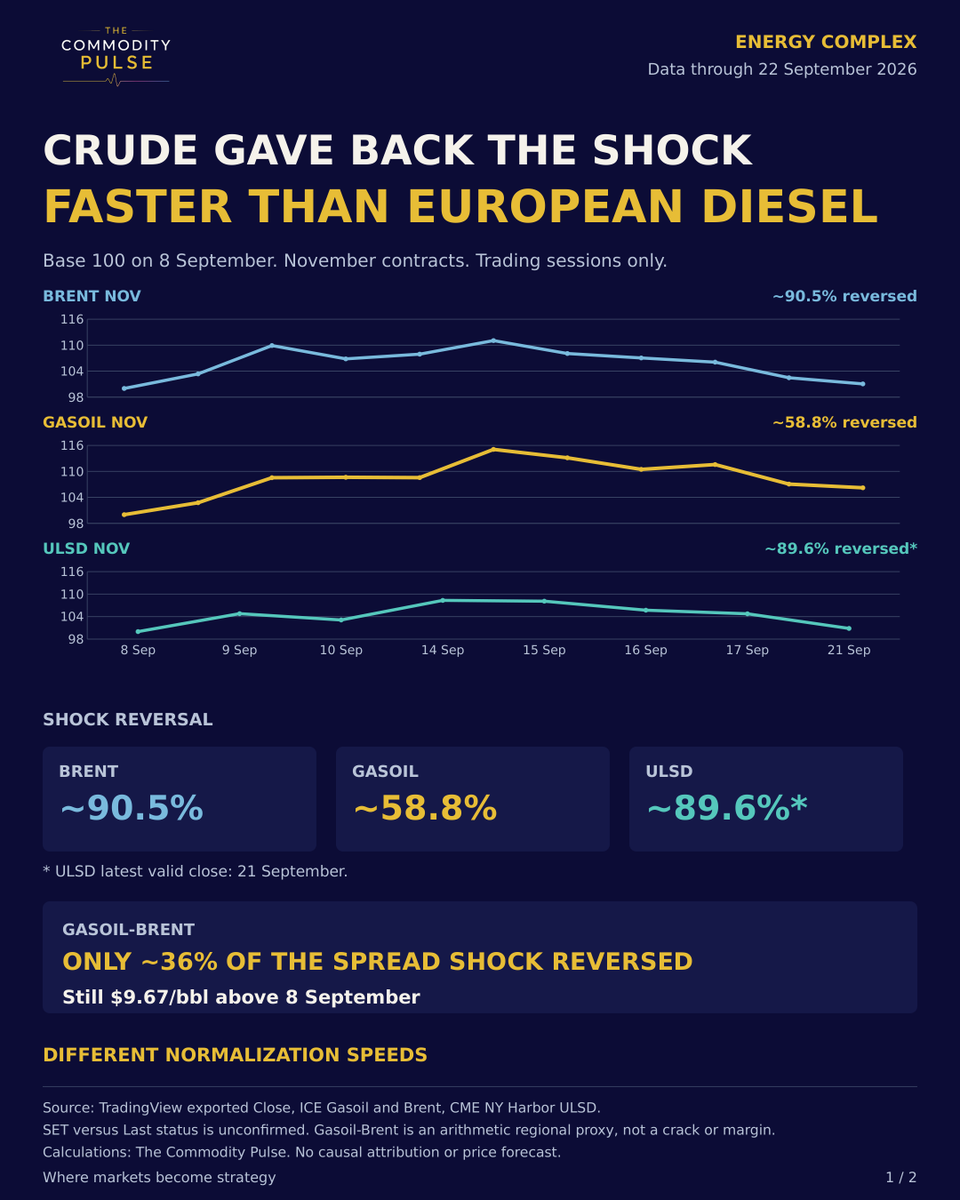
Brent reversed ~91% of its shock. Gasoil: ~59%. Gasoil−Brent: ~36%.
Yet prompt gasoil has normalized faster.
Same energy system. Different recovery speeds.
The Commodity Pulse
Where markets become strategy
SBO ≈ Gasoil.
But not because soybean oil rallied with energy.
The signal is the relationship: energy repricing changed the relative-value map around vegetable oils.
A price alone misses that.
The Commodity Pulse
Where markets become strategy
India port stocks:
CPO −10%
SBO +4%
Sunflower −6%
If duties change, 3 oils start from different physical positions. But stocks don't determine the next marginal buy.
The Commodity Pulse
Where markets become strategy
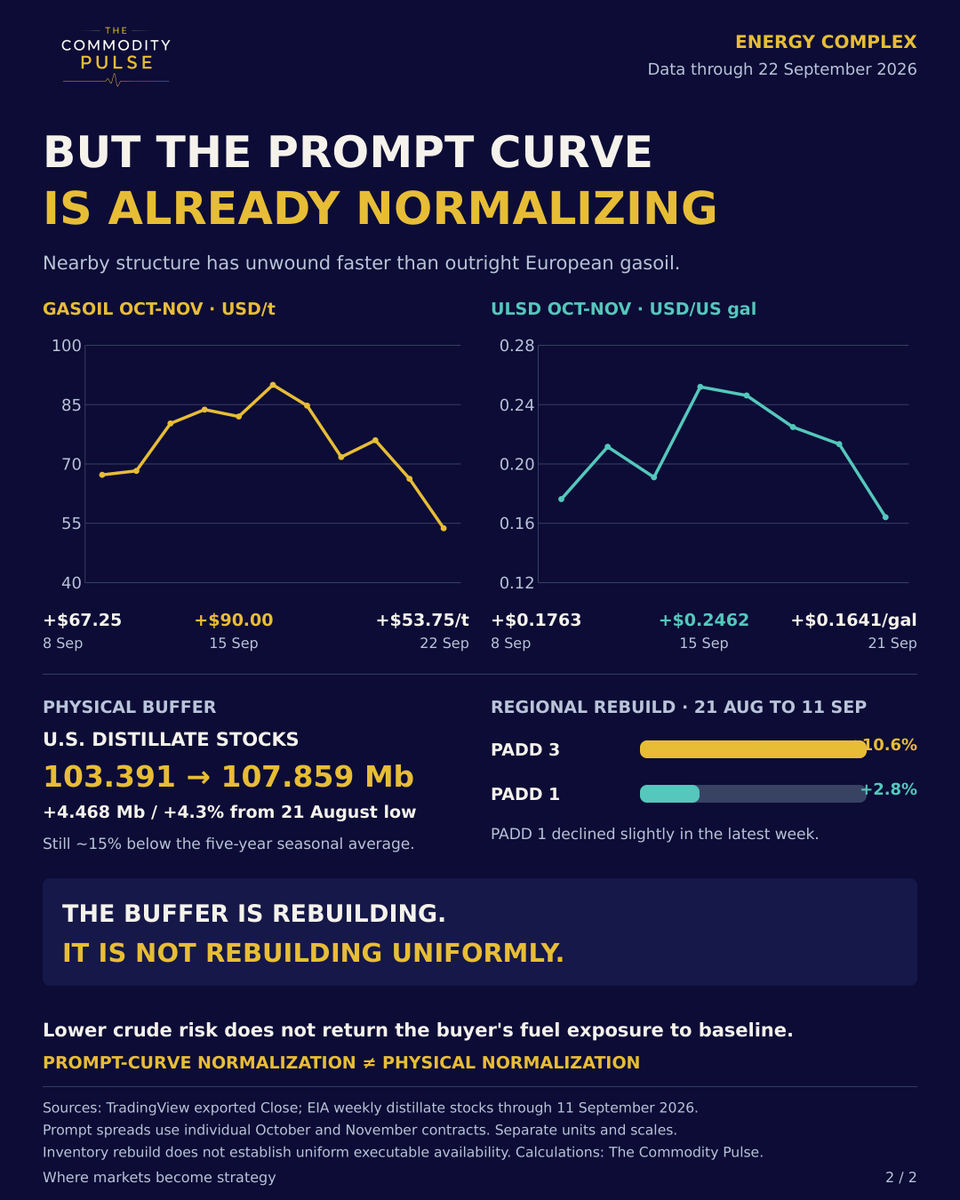
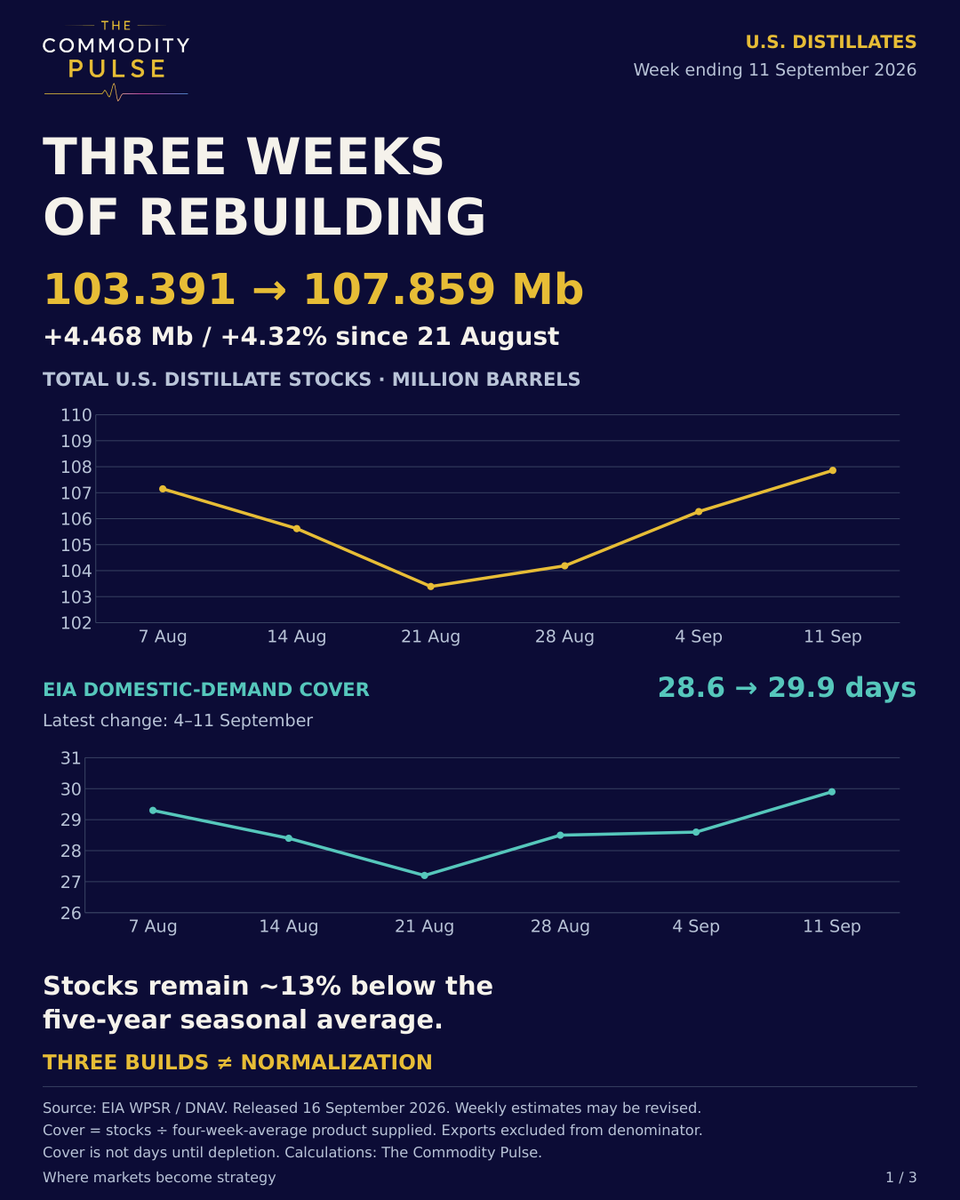
U.S. distillate stocks are rebuilding.
But 78.8% of the latest build came from PADD 3—and just 7.4% of its increase was ≤15 ppm.
More inventory ≠ uniform ULSD availability.
The Commodity Pulse
Where markets become strategy
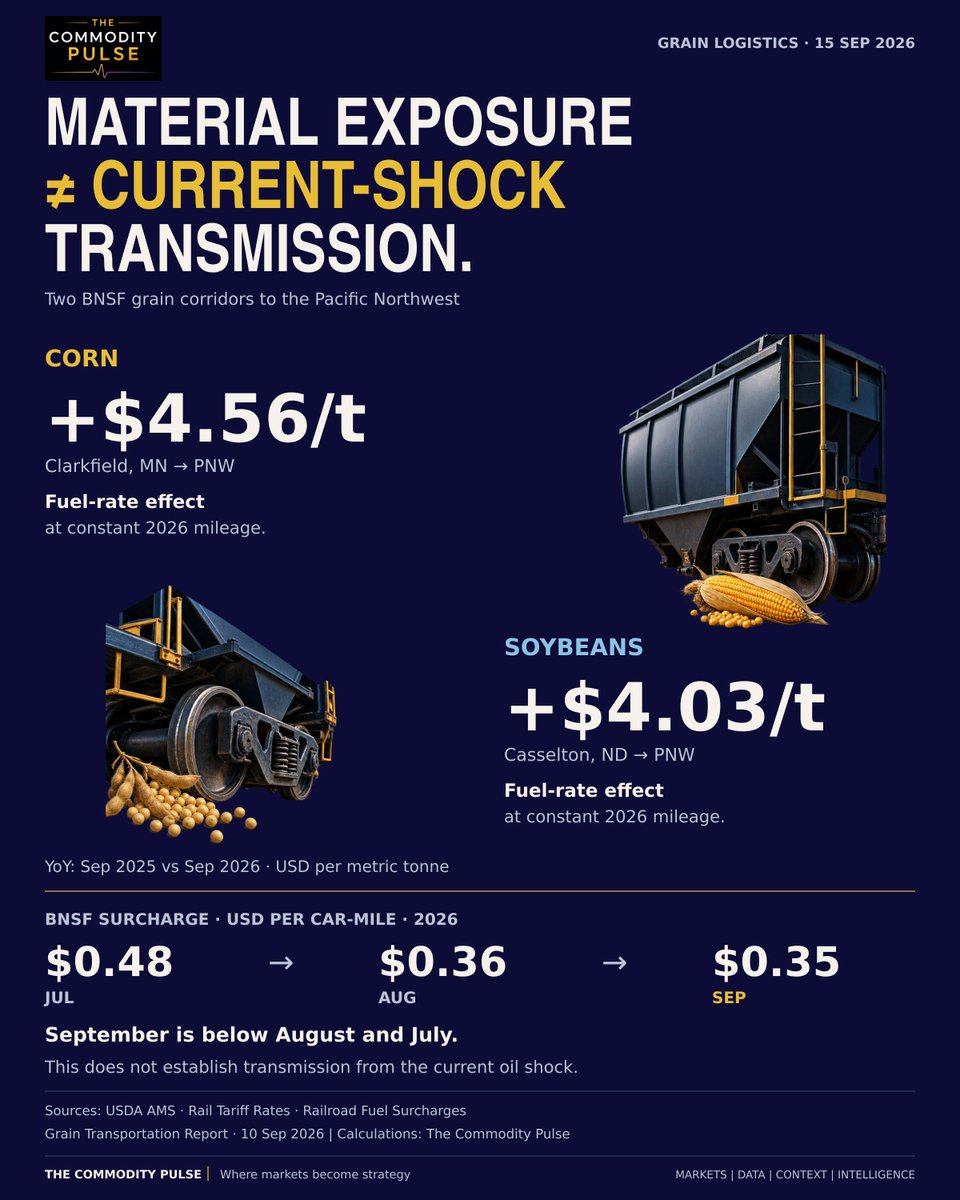
Fuel already matters in U.S. grain rail costs.
At constant mileage, the higher BNSF fuel rate adds ~$4.56/t to corn and ~$4.03/t to soybeans.
But Sep is below Jul–Aug.
Material exposure ≠ current-shock transmission.
The Commodity Pulse
Where markets become strategy
Malaysia Aug palm exports: 1.295 Mt.
Stock-flat sensitivity under the same Aug balance: 1.491 Mt.
Gap: ~196.6 kt / 15.2%.
Better exports ≠ sufficient absorption. The threshold changes when the balance changes.
The Commodity Pulse
Where markets become strategy
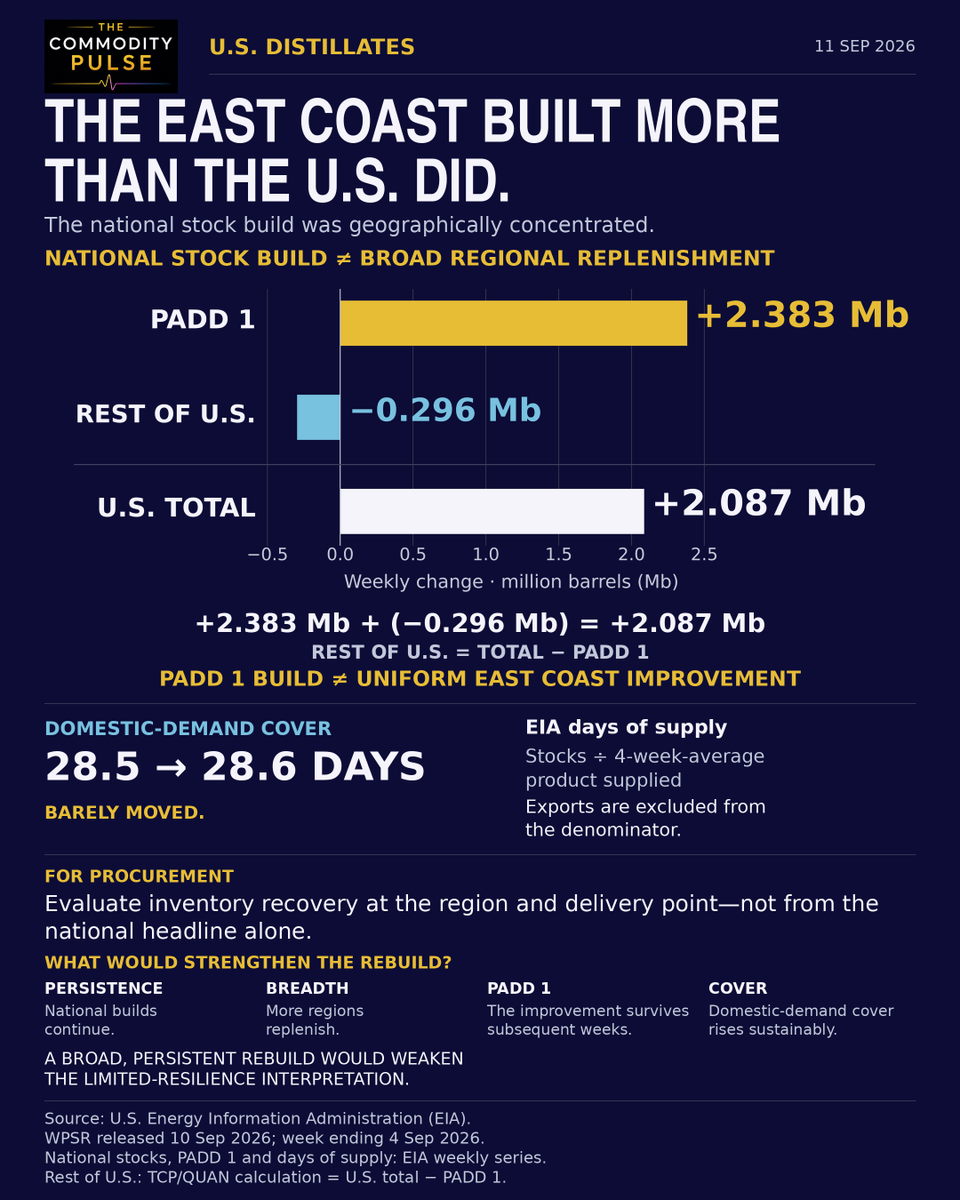
U.S. distillate stocks +2.087 Mb.
PADD 1 alone: +2.383 Mb.
Rest of U.S.: −0.296 Mb.
The rebuild is real—but concentrated.
Next test: does replenishment persist and broaden?
Source: @EIAgov
The Commodity Pulse
Where markets become strategy
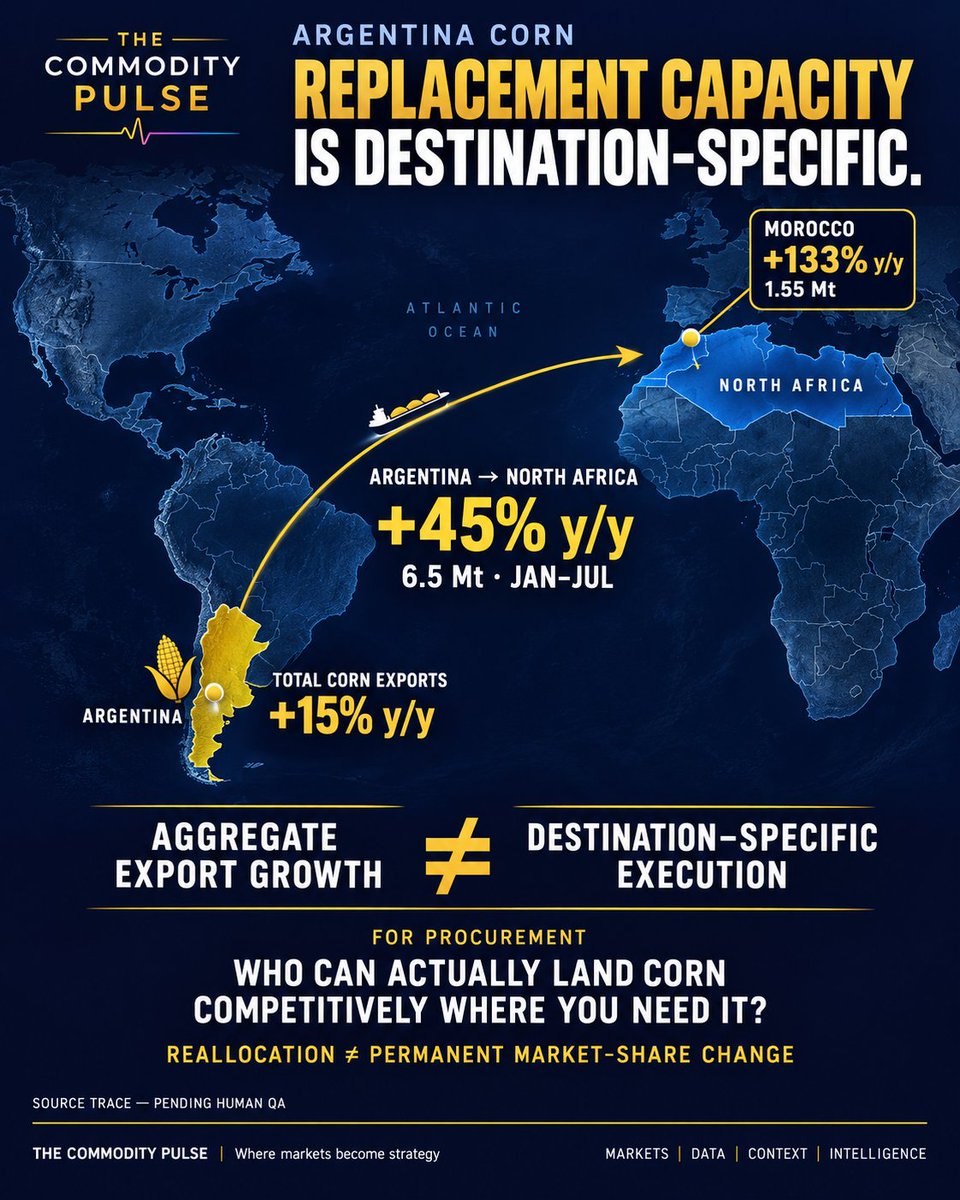
Argentina corn exports: +15% y/y.
Into North Africa: +45% / 6.5 Mt.
The gap matters. Replacement capacity depends on execution into a specific destination—not just national supply.
The Commodity Pulse
Where markets become strategy
Crude available ≠ diesel available.
Global refinery throughput: ~−5 mb/d YoY.
Russia + Middle East + Asia diesel exports: −1.3 mb/d.
U.S. utilization: 98%.
The constraint is conversion.
The Commodity Pulse
Where markets become strategy
China can have plenty of soybeans while the next tonne remains unattractive to buy.
Brazil import economics: ~−CNY207–221/t.
Sinograin proxy: ~+CNY268–278/t.
Next gate: crusher runs.
The Commodity Pulse
Where markets become strategy
Same hub. Opposite inventory signals.
Fujairah:
Heavy distillates −15%
Middle +19%
Light +25%
The divergence matters more than the headline: scarcity can migrate across the barrel.
The Commodity Pulse
Where markets become strategy
An inventory draw can reflect weaker output or stronger absorption. Which would matter more for your procurement assumptions? Read the balance before changing the view.
The Commodity Pulse
Where markets become strategy
U.S. refinery utilization: 98%.
Yet distillate stocks remain 14% below the 5Y avg—and PADD 1 fell 8% WoW even as national stocks rose.
Response ≠ resilience.
The Commodity Pulse
Where markets become strategy