@rcolvile@TheIFS See where you are coming (and agree more on e.g. student loans) from but I guess with auto-enrolment:
- it's DC - it's your money. Cannot be changed like PAYG system
- There is employer top-up
- you get tax-deferral benefit
So wonder if the extra 'missing' tax is thaaat large
@PatriciaNPino@afneil Why this is important:
Larger, more sudden inflations are much more stressful for workers + uncertainty premium which makes firms less likely to invest. UK with large CA deficits == more dramatic FX weakness as well.
@PatriciaNPino@afneil Mechanism:
Big fiscal expansion markets don't like with long term debt: -ive wealth effect for holders of long term debt. Immediate inflation impact smaller, spread over long term
Without long term debt: immediate increase in money supply inflationary without dampeners above
@DEhnts Conventional Econ can easily deal with this interpretation of 'financing'
More pertinent questions:
how much inflation is too much?
Do u care about the dynamics for non reserve asset countries with large current account deficits?
are private property rights important or not?
@GreatBritishTT Defo true tho, that of the uk’s meagre growth, a v large amount has been from gov consumption which is unusual outside recession/crisis periods
Unit Labour Costs in the UK have gone from some of the most competitive in the G7, to the worst since the introduction of the National Living Wage in 2016 (and amplified by employer NICs, and the recent ERA). Yet politicians trumpet it as one of their signature achievements. The overall package has made employing young people increasingly unattractive for employers.
@7Kiwi Obviously bad policies like spending billions on insulation or badly targeted carbon taxes will be bad for growth.
But you do have to control for developed countries that grow less quickly for reasons not to do with emissions.
@7Kiwi The richest in countries in 1990 show no relationship between GDP growth per cap and emissions growth
Most countries have had more GDP growth than emissions growth over the period
It's flimsy. There was other stuff going on in the world which likely flatters others around 2016 (particularly eurozone late recovery and Trump tax cuts)
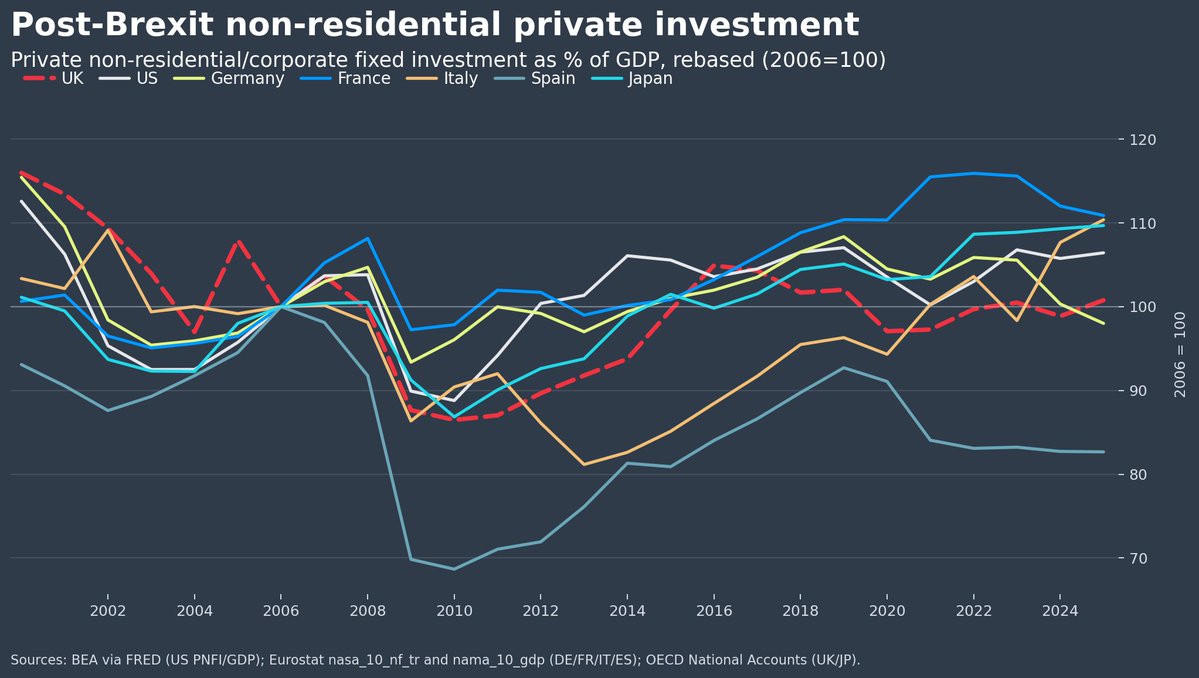
2016 version for interest (ps - be wary of the Italian numbers. super deduction ended - will almost certainly fall lots):
If you plot growth on this measure, but rebase to 2006 it's hard to paint a picture of devastation.
No doubt investment would be higher without Brexit, but I just caution fixating on rebasing to one point in time and coming to grand conclusions.
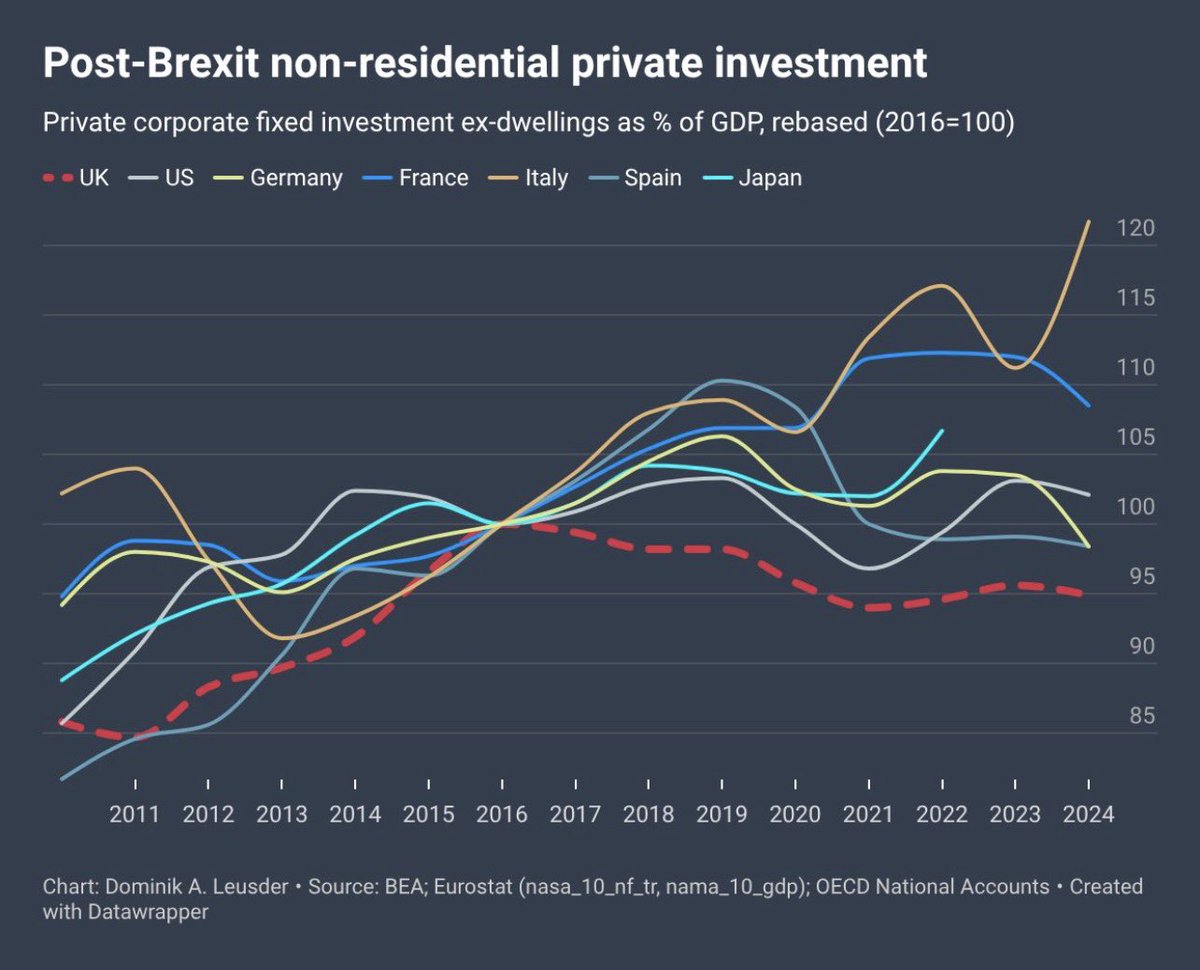
Now what would a more honest measure look like?
The standard way of calculating this is private corporate fixed investment excluding dwellings as a share of GDP.
Thanks to @NewLeftEViews we can see very clearly there is one strong loser post-2016 and it is 🇬🇧.
If I rebase this to 2006. You really cannot conclude anything. My point being, this is kind of a bullshit measure.
We get peaks/troughs inflections in other countries at different dates outside recessions. Not much of a signal of anything.
Now what would a more honest measure look like?
The standard way of calculating this is private corporate fixed investment excluding dwellings as a share of GDP.
Thanks to @NewLeftEViews we can see very clearly there is one strong loser post-2016 and it is 🇬🇧.
This is not 'growth' in investment. It's just growth relative to other components of GDP.
Most eurozone countries had a slower recovery from GFC, which might have meant a slower recovery in investment/GDP.
not rebasing (no tricks), as a *share* of GDP, investment in the UK is basically at its pre GFC naughties baseline.
Should it be higher? probably.
But German and US investment as share of GDP basically flatline at the same time.
Not sure this really says that much?
Now what would a more honest measure look like?
The standard way of calculating this is private corporate fixed investment excluding dwellings as a share of GDP.
Thanks to @NewLeftEViews we can see very clearly there is one strong loser post-2016 and it is 🇬🇧.
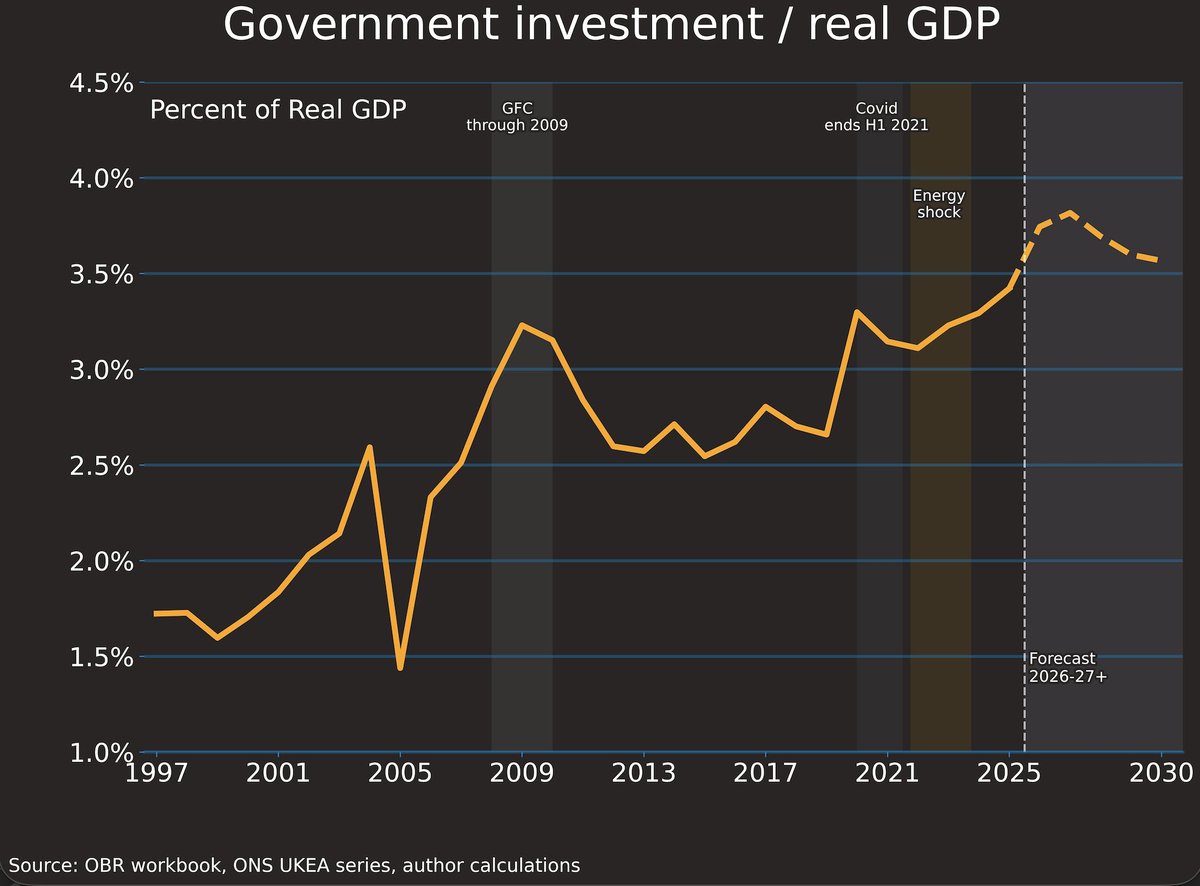
Public sector investment crowds out private sector investment. Another reason why you can't just read one line off a chart and come to a firm conclusion.
Consumption is roughly same % of GDP as 20 years ago. I'm not really sure what this is saying?
I mean sure, maybe we should consume less and invest more... but if you want to make that argument also need to take account of public sector investment which is rising as % of gdp
Just digging into that question of how Brexit damaged investment in Britain we have another good chart by @NewLeftEViews on the non-financial net fixed capital formation as a percentage of GDP. This is the clearest metric to see how the productive side of the economy is growing. And the rate was still below 2016 a decade later.
Also that trend is contentious. Starting at worst point in GFC to 2016 implies a higher long run trend then doing a trend through the entire business cycle.
For comparisons also have to be aware that eurozone countries recovered later as well.
Let’s go through this again.
Before 2016 🇬🇧 was ahead of most G7 peers on business investment. Growth was ~6% a year 2010-2016, in line with the G7 average.
Look at the nine quarters before the referendum: 🇬🇧 non-dwellings investment +4.0%. G7 average: +3.9%.
However in the nine quarters after: 🇬🇧 +<2%. Every other G7 economy: +6%+.
By 2024, 🇬🇧 whole economy investment was 17.8% of GDP — lowest in the G7.
Further graph picked a quarter earlier.