The Market is always Preplanned. Our jobs as traders is to find the measured moves and which trades were the ones worth taking along with proper risk management! Join us in our free discord so we can show off Navigator every day!
https://t.co/wONtBfSlK7
#NQ The furus are all yelling shorts and longs and when they are right after being wrong for way more then the average trader can hold through their account eventually they are right and will say see! I told you so! Its not my fault you do not have the proper risk management......
Learn when to quit. The average trader is getting chopped up today because someone on X has said the bottoms not in yet. Hows the account doing?
Showing the average Joe how to trade, and when is best to take profit is our goal. With a model and statistics we can show you where price wants to go based off of the previous sessions.
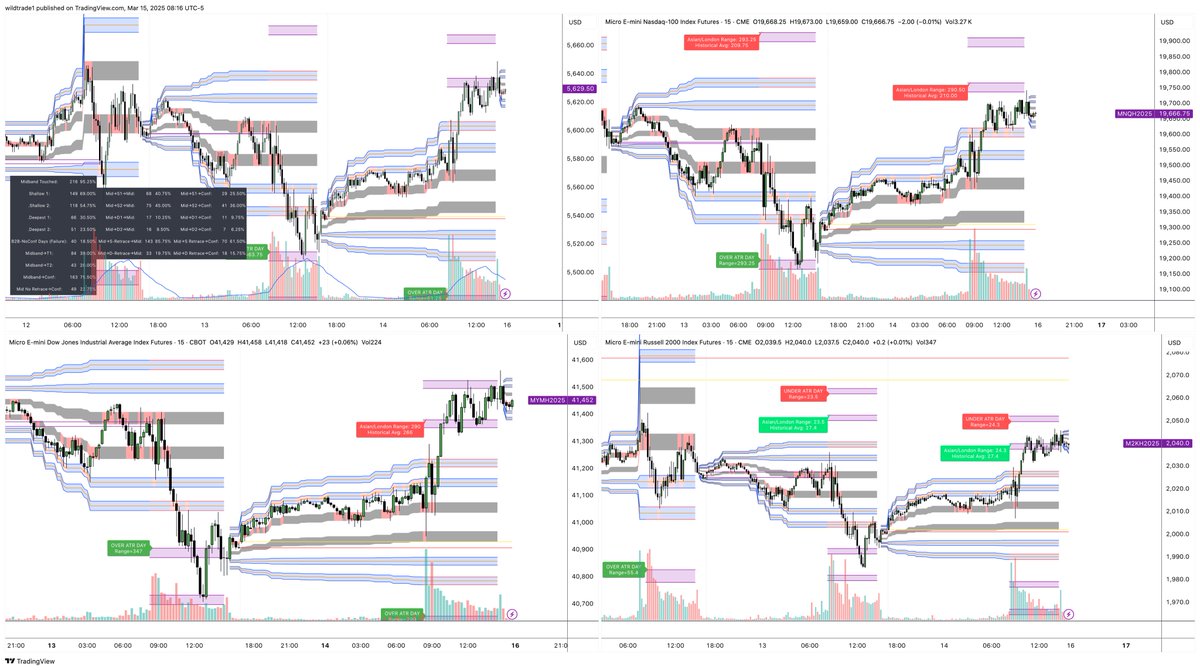
Check out my #M2K1! analysis on @TradingView: /chart/M2K1!/Rdmadbyc-What-a-nice-couple-of-days-across-the-indices-ES-NQ-YM-RTY/ Having the advantage of stats is a game changer. Let me know if ya want access to the tools
Navigator. Knowing where PA wants to consistently go/not go based on what it has done in the past.
Statistics so you know how to manage your trades that you’re in or the best entries if you’re looking. Without this type of information you’re just trading blind!
There’s no repainting, the model is locked in at market open, DM me for a 5 day trial to bring your trading to the next level!
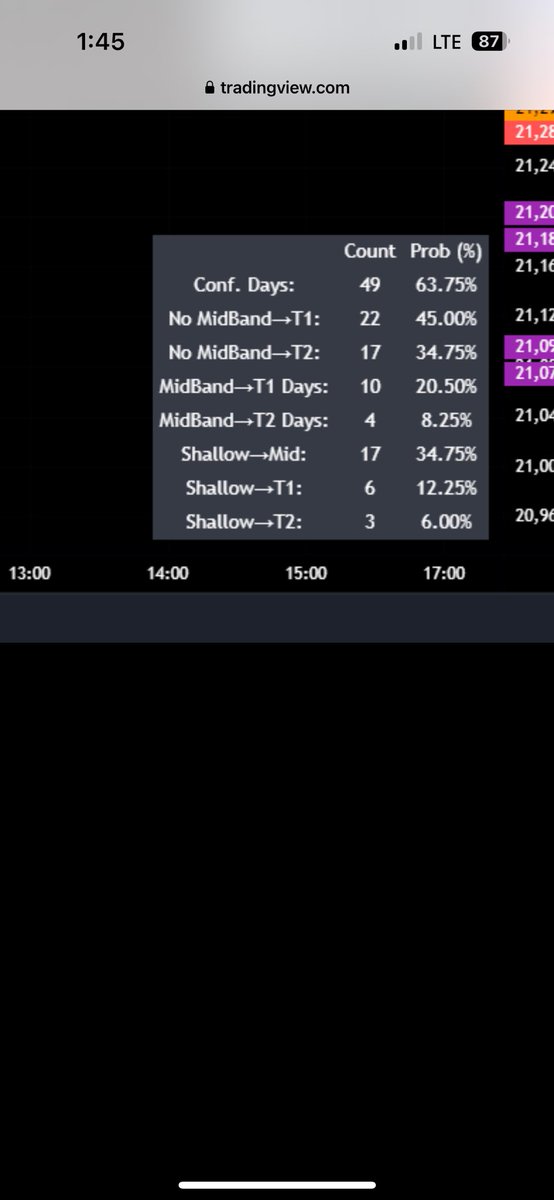
Now we look at the bottom stat table and realize the more we retrace how quickly the chances of hitting T1 (the purple target) gets. Of the last 49 days it has gone back up to the mid and then down to T1 10 times. So you only have a 20.50% probability of that working anymore! If we come to the first touch of the retracement range (the grey bands) we drop to 12%!
Statistics WILL help you save or make an account once you know where price wants to go and where it does not!
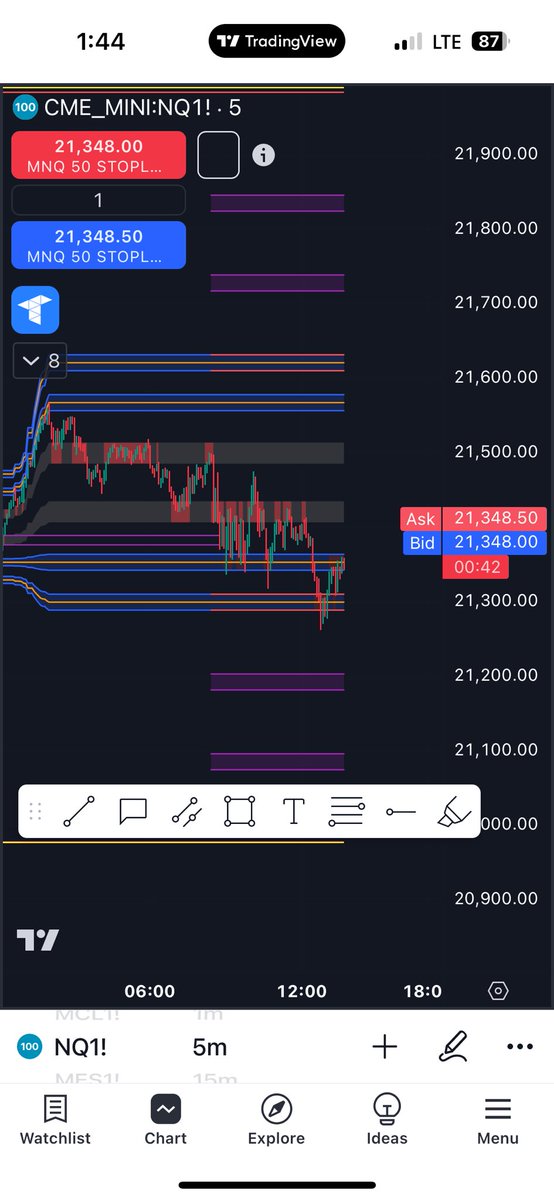
Check out my #NQ1! analysis on @TradingView: https://t.co/CQbjjVfFin Statistically speaking right now we have a 68.50 % probability of confirming to the downside of #Navigator after we have had a midband touch based off of historical days! The more information the better Trader you will be! #NQ #qqq #futurestrading #FutureScientists
Check out my #NQ1! analysis on @TradingView: https://t.co/CQbjjVfFin Statistically speaking right now we have a 68.50 % probability of confirming to the downside of #Navigator after we have had a midband touch based off of historical days! The more information the better Trader you will be! #NQ #qqq #futurestrading #FutureScientists
So here is one of our newest indicators Wildtrades opening range. Its customizable for if you want to track the London or Rth session,
The size of the opening range is Based off of your chart settings, And you get Statistics on what has happened in the past days of historical viewing of Tradingview. Of course the smaller the time chart you are on the more False breakouts to the opposite side you will see. But you can use that to your advantage now and see how far Price generally moves in the first direction before returning into the range for a false move! Add that to where your current area of interest is and it can be a powerful tool!!! #Openingrange #londonopen #RTH #futures #StockMarket #Statistics #NQ #QQQ
Check out my #RTY1! analysis on @TradingView: https://t.co/fI0ZuUrzM2 We have a lot of Ndogs (New day opening gaps) to the downside that line up pretty well with #Daytraders levels. A lot of times they can act like magnets or support/resistance. We track them and when price touches them during RTH they will stop advancing and turn purple to show they have been satisfied. #Daytrader #futurestrading #Tradingview #Russel #TradingTips