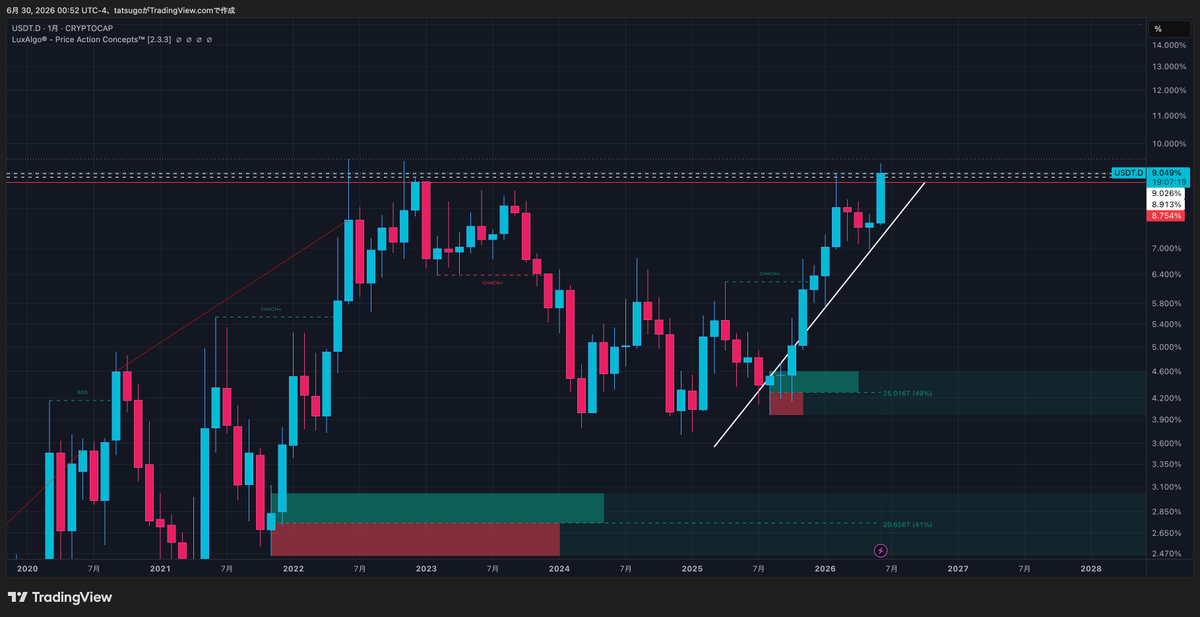
USDTドミナンス月足
月足は明日7/2日本時間朝9時に確定します。
見ての通り、2023年の高値を今は本体で上抜けている ので、動き自体は少し強いです。
ただ、本当に大事なのはこのまま月足で確定できるかどうかです。
もし明日の月足確定で 赤の数値 8.754% を維持、もしくは本体でしっかり上抜けたまま終わるなら、BTCはまだ少し弱い状態が続くと見ています。
もちろんマクロの話です。
USDT Dominance monthly.
The monthly candle will close tomorrow at 9:00 AM Japan time.
As you can see, USDT.D is currently breaking above the 2021 high with the candle body, so the move itself looks somewhat strong.
But the real key is whether it can hold this into the monthly close.
If the monthly candle closes while holding, or clearly reclaiming, the red level at 8.754%, I think BTC may still remain somewhat weak from a macro perspective.
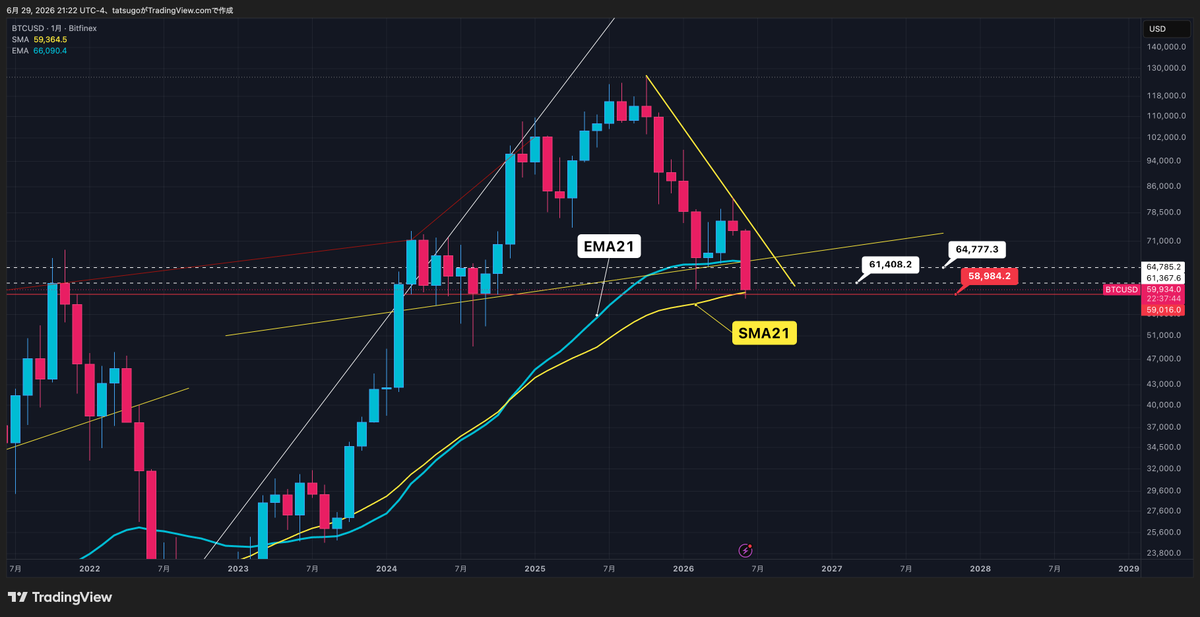
BTC月足
あと22時間で月足が確定します。
今は EMA21を下抜け、SMA21付近で止まっている状態 です。
かなり大事な場面ですね。
特に 58,984.2 の赤数値を月足で下回って終わるのか。
ここはしっかり見たいです。
一方で、上にある 61,408.2 の白数値は、今のところかなり強い抵抗として意識されると思っています。
つまり今は、下を守れるか、上の重さに押さえつけられるかの分岐点です。
BTC monthly.
There are 22 hours left until the monthly close.
BTC is now trading below the 21 EMA and around the 21 SMA, which makes this a very important spot.
The key is whether BTC closes the month below the red level at 58,984.2.
That is the level I’m watching closely.
At the same time, the white level at 61,408.2 looks like a strong resistance for now.
So this is a major decision area between holding support below and facing heavy resistance abov.
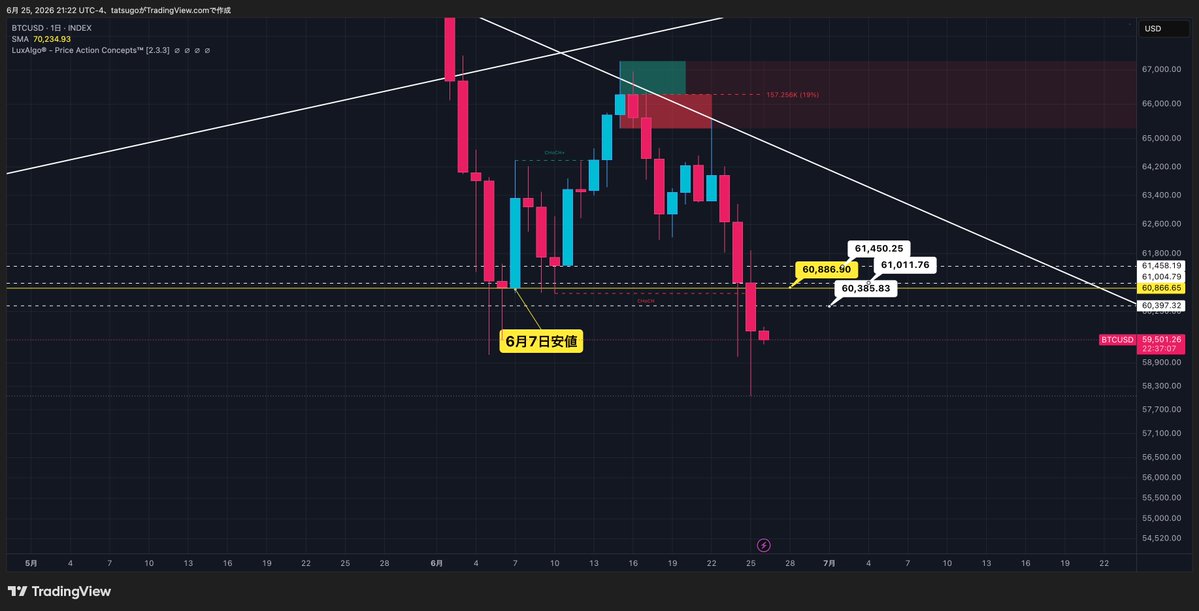
BTC日足・週足・月足
日足、週足が確定 6/29
日足はローソク足で安値を更新。
週足も 200週移動平均線 をしっかり下抜けており、相場がまだ弱いことは明確です。
そして月足は、今のところ SMA50 で止まっています。
ただ、あと2日で月足が確定しますが、もし 59,008.71 を下回って終わるなら、7月前半にもう一段下を試す可能性が高いと見ています。
上では
60,178.78
60,761.55
61,458.50
この3つが、反発しても意識される戻りの抵抗帯です。
今は短期の反発よりも、週足と月足の位置を重く見ています。
まだ強気で見る場面ではないと思っています。
BTC daily, weekly and monthly.
The daily and weekly candles have now closed.
The daily candle has made a lower low, and the weekly chart has clearly broken below the 200-week moving average, which tells me the market remains weak.
On the monthly chart, price is currently sitting right on the 50-month SMA.
But with 2 days left until the monthly close, if BTC closes below 59,008.71, I think there is a high chance of another leg down in early July.
On the upside,
60,178.78
60,761.55
61,458.50
are the key rebound resistance levels I’m watching.
Right now, I’m putting more weight on the weekly and monthly structure than on any short-term bounce.
BTC日足確定 6/27
昨日は一応陽線で終わりました。
下ヒゲを見ると、短期では少し切り上げています。
ただ、月足チャートも重ねて見ると、
2024年3月から10月にかけて意識された価格帯 が、今はレジスタンスとして機能しているように見えます。
月足確定まではあと4日。
今の価格帯で終わるなら、7月初旬にもう一段下を試す可能性もまだ高いと見ています。
週足、月足ともにかなり大事な場面です。
今は方向感に惑わされやすいので、無理に決めつけず、ゆっくり見ていきたいです。
BTC daily.
Yesterday’s candle did close green, and the lower wick suggests price is trying to hold up in the short term.
However, when I also look at the monthly chart, the zone that was important from March to October 2024 now appears to be acting as resistance.
There are still 4 days left until the monthly close.
If BTC stays around this area into month-end, I think there is still a high chance of another leg down in early July.
Both the weekly and monthly charts are at a very important point here.
This is the kind of area that can easily confuse traders, so I do not want to rush the conclusion.
USDTドミナンス日足確定 6/26
ここ最近ずっと抜けられなかった(2月6日、6月10日)高値を、本体で上抜けてきました。
さらに MACDはゴールデンクロス2日目。
上値はまだ少し重たそうに見えますが、高値はヒゲで切り上げており、上に行こうとする力はまだ強いと見ています。
USDT.Dがこのまま上を維持するなら、BTCとアルトには引き続き厳しい地合いが続く可能性があります。
USDT Dominance daily.
USDT.D has now reclaimed a recent high that price had failed to break for a while, this time with the candle body.
Also, the MACD is now on day 2 of a bullish crossover.
The upside still looks a bit heavy, but the wick highs are rising, which suggests the upward pressure remains strong.
If USDT.D can hold this breakout, it likely remains a headwind for BTC and altcoins.
BTC日足確定 6/26
6月7日の安値 を下抜け弱い形が続いています。
上では
60,385.83
60,886.90
61,011.76
61,450.25
このあたりが戻りの抵抗帯として意識されそうです。
さらに、デイリーMACDもデッドクロス。
戻してもこの価格帯では売られやすく、今のところはまだ下目線を崩していません。
BTC daily.
BTC has now broken below the June 7 low, and the structure still looks weak.
On the upside,
60,385.83
60,886.90
61,011.76
61,450.25
look like key rebound resistance levels.
Also, the daily MACD has crossed bearish.
Even if price bounces, I think this area is still likely to attract selling for now.
Bitcoin日足確定 6/25
今日の終値が6月11日の安値 を本体で下抜けました。
今は前回安値付近で大きく反発していますが、まだ弱い流れが続いていると見ています。
上では
61,563.6
61,790.3
62,203.4
62,759.4
このあたりが意識される戻りのポイント。戻してもまだ売られやすいと見ています。
BTC daily.
BTC has now broken below the June 11 low with the candle body.
Price is bouncing sharply near the previous low for now, but I still think the broader tone remains weak.
On the upside, I’m watching
61,563.6
61,790.3
62,203.4
62,759.4
as key rebound levels.
Even if price pushes into that zone, I think it may still face selling pressure for now.
BTC週足ラインチャート
前回の動画でも触れた通り、3週間続けて下抜けできなかった 200週移動平均線 を、今はラインチャートで下抜けています。
週足確定まではまだ4日ありますが、今の価格帯で推移するなら、次は 54,801.3 付近までを一旦見ています。
ここはかなり強いサポートです。
逆に、この 54,801.3 を下抜けてくると、今度は下にある 350週移動平均線 が意識されてきます。
2021年のベアマーケットでは、この350週移動平均線で下げ止まりました。
BTC weekly line chart.
As mentioned in my previous video, BTC is now breaking below the 200-week moving average on the line chart after failing to do so for the past three weeks.
There are still 4 days left until the weekly close, but if price stays around this area, I think the next level to watch is around 54,801.3.
That looks like a very strong support zone.
If 54,801.3 breaks, then the 350-week moving average below may start to come into focus.
In the 2021 bear market, BTC found support at that 350-week moving average.
USDTドミナンス日足確定 6/24
下の
8.667%
8.685%
8.711%
この3つは抵抗帯として意識されると思います。
昨日お伝えした通り、6月6日から続いていた持ち合いのチャンネルは上にブレイクしました。
この動き自体は強いです。
ただ、一番大事なのは上の 8.767%。
ここを月足確定までに上抜けてくるなら、7月もBTCとアルトには引き続き厳しい流れが続く可能性があります。
USDT Dominance daily.
The lower levels at
8.667%
8.685%
8.711%
may now act as a resistance zone.
As mentioned yesterday, the consolidation channel that had been forming since June 13 has now broken to the upside.
That move itself looks strong.
But the most important level is still 8.767% above.
If USDT.D breaks above that before the monthly close, BTC and altcoins may continue facing downside pressure into July.
BTC日足確定 6/24
6月19日の安値 を本体で下抜け、日足のトライアングルも下に抜けてきました。
上では
62,878.33
63,076.05
63,136.09
この3つが、戻ってきてもかなり重い抵抗帯になりそうです。
そして一番重要なのは 60,729.84。
ここを下抜けると、下落は一気に加速する可能性があります。
BTC daily.
BTC has now broken below the June 19 low with the candle body, and the daily triangle has also broken to the downside.
On the upside,
62,878.33
63,076.05
63,136.09
look like a heavy resistance zone even if price bounces.
The most important level is 60,729.84.
If that breaks, the downside move could accelerate sharply.
This looks like a very important spot right now.
速報🧐USDTドミナンス8時間足
本体でチャネル上抜けを先ほど確定しました。
6月6日以来、約16日ぶりの本体上抜けです。
やはりブルフラッグ継続の形だった可能性があります。
ただ、ここで決めつけず、次は日足確定でどうなるかを見極めたいです。
USDT.Dがここからさらに強くなるなら、BTCやアルトには引き続き向かい風になりやすいと見ています。
USDT Dominance 8H.
The candle has now confirmed a body close above the channel.
This is the first body breakout since June 6, roughly 16 days ago.
It may have been a bullish flag after all.
That said, I do not want to make a full call yet. The next key will be how the daily candle closes.
If USDT.D keeps pushing higher from here, it likely remains a headwind for BTC and altcoins.
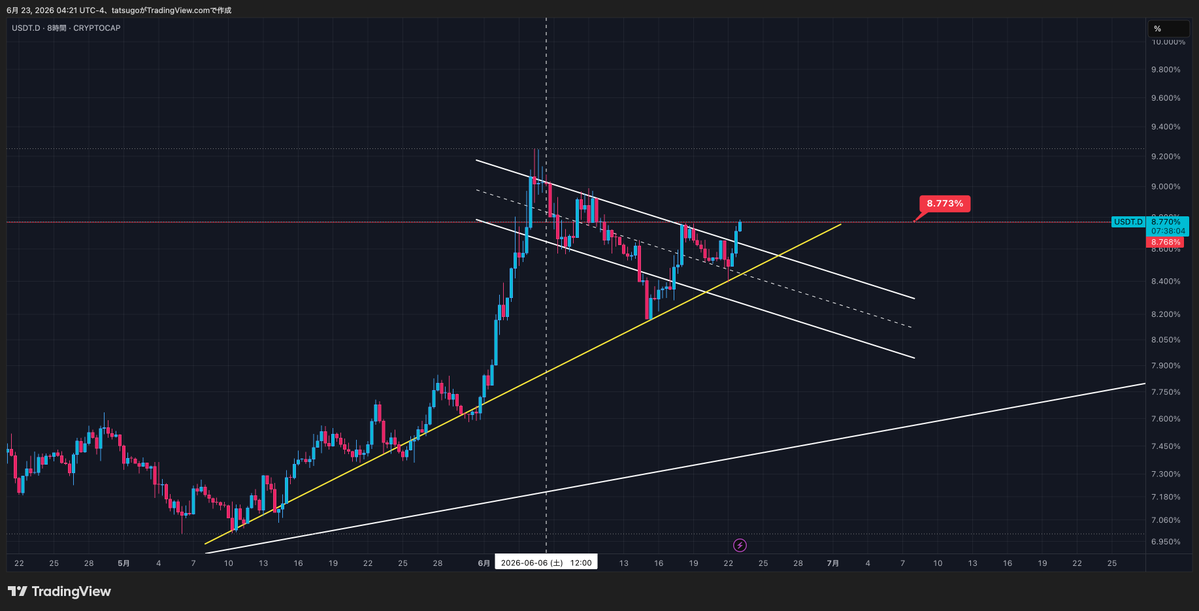
USDTドミナンス8時間足
まだ持ち合いが続いています。
形としてはブルフラッグにも見えますが、一番見ているのは 5月10日から続く黄色のトレンドライン です。
ここにタッチすると、 6月はBTCが大きく反応して上昇している場面が続いています。
少なくとも 6月28日ごろ には、このトレンドラインに到達してくる可能性があるので、それまでは判断が少し難しいかもしれません。
USDT Dominance 8H.
Price is still moving in a consolidation range.
It can look like a bull flag, but the main level I’m watching is the yellow trendline that has been in place since May 10.
Each time price has touched that line, BTC has reacted with a strong move higher.
At the very least, price may reach that trendline around June 28, so until then, the market may remain difficult to judge.
BTC日足確定 6/23
昨日の動画のあと大きく上げましたが、日足のサポートバンドにぴったり当たって、上ヒゲをつけて押し戻されています。
ただ、今のところ下もそこまで崩れておらず、まだ底堅く動いています。
そのため、週足確定まではもう少しじっくり見ていきたいところです。
ポイントは、昨日つけた上ヒゲの高値 65,597.66 を超えられるかどうか。
ここは目安になる上ヒゲだと見ています。
BTC daily.
After yesterday’s video, BTC pushed higher and tagged the daily support band almost perfectly, but then got rejected with a long upper wick.
That said, price still has not broken down hard and is holding relatively firm for now.
So with time still left before the weekly close, I think this needs a bit more patience.
The key level is yesterday’s upper wick high at 65,597.66.
I see that wick as an important reference point from here.