We are apparently at the part where the ones who were wrong in 2021 because “the cycle”, are now certain of no new ATHs for years because “the cycle”.
I used to be one. I remember when my belief in a predictable 4-year heartbeat of blow-off tops that would make everyone rich, made me allergic to other interpretations.
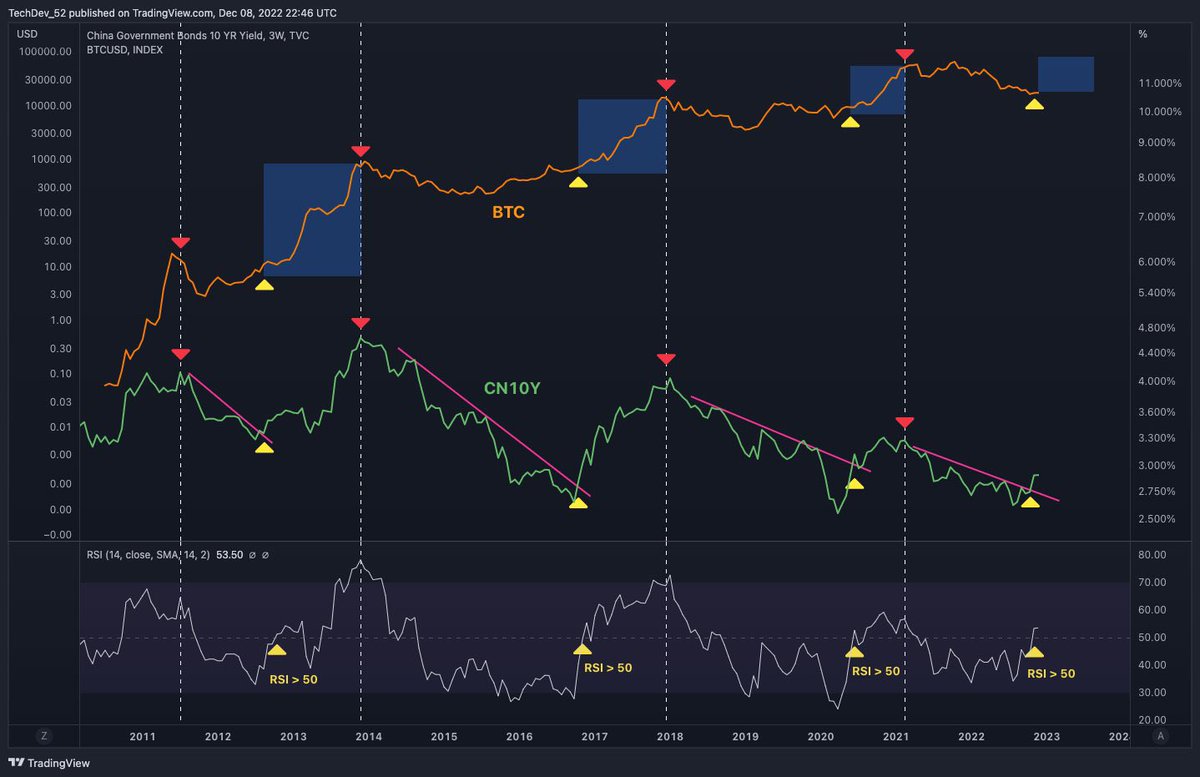
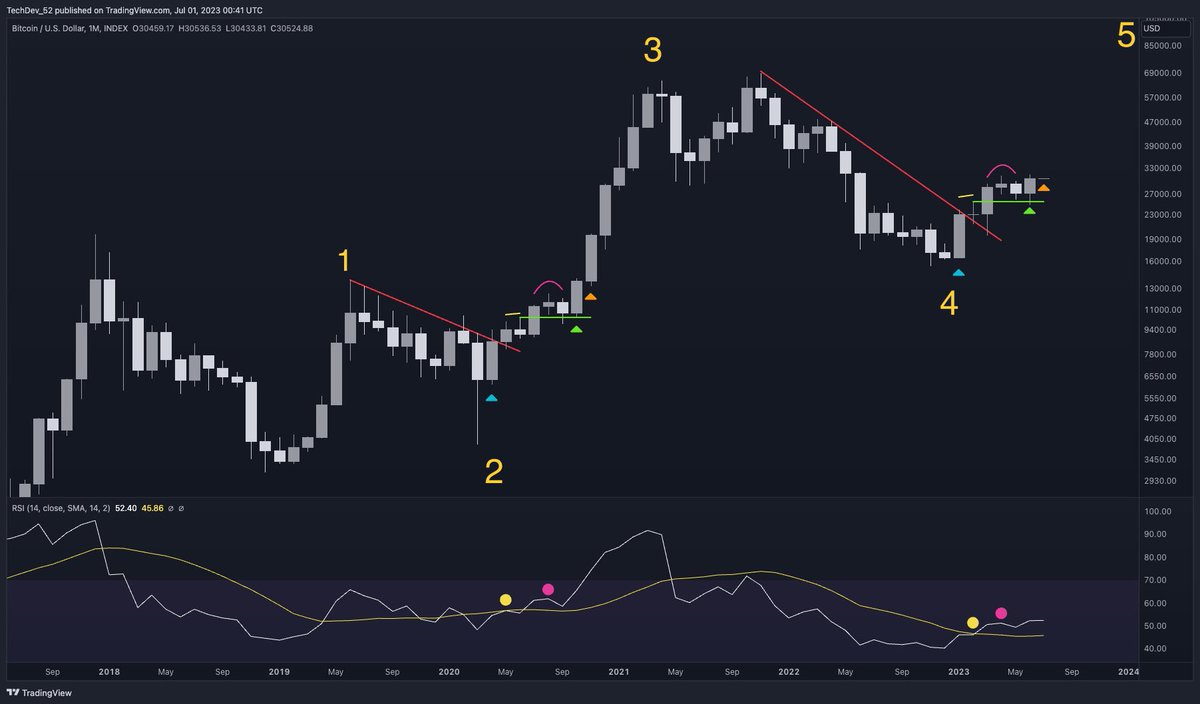
Perhaps we are in the same macro impulse wave that began in 2019, and are seeing a similar early structure to the current sub-impulse as we did with the last (late 2020).
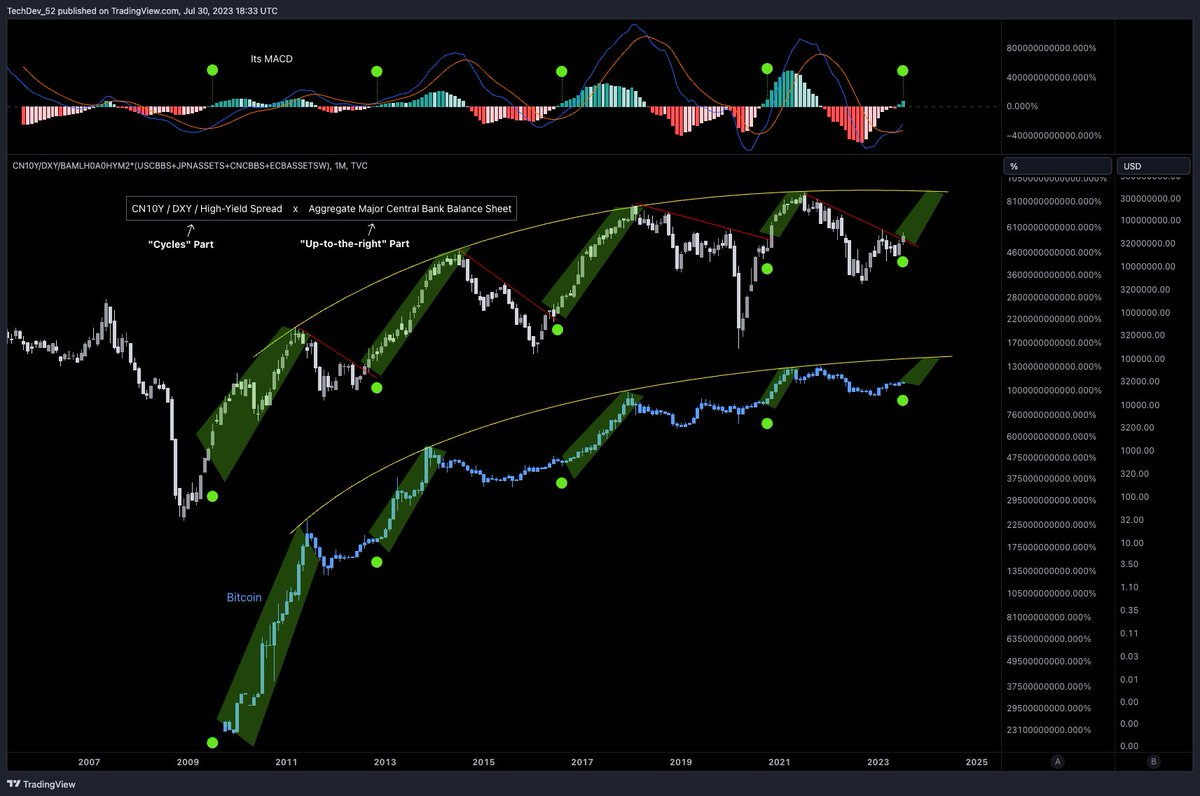
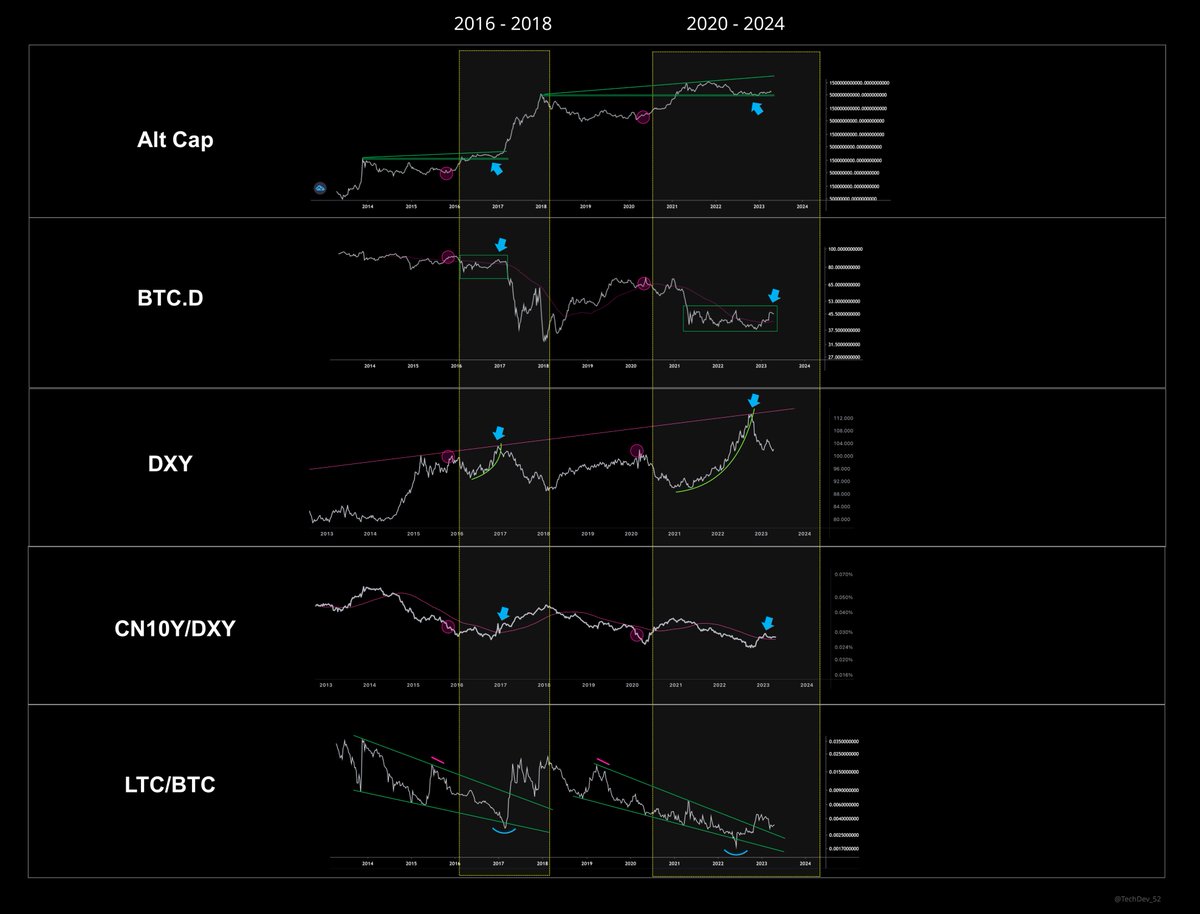
Or perhaps the 4 year cycle (closer to 3.5 years) if there is one, is driven by liquidity, not the halving. Perhaps we are in the early stages of a parabolic leg, similar to late 2015/2016, and those who can’t look before 2019, won’t get “one more big dip”.
If the last 2 years have taught me anything, it’s that history much more rhymes than repeats, but that rhyming can happen cross asset. #Bitcoin in my opinion, at this stage, is a speculative asset, subject to the same forces that drive any other. Be careful of blind devotion to a special “cycle” with its own set of rules. Especially ones that are supposedly easy to follow. The market never makes it easy.
Last #Bitcoin issue featured:
✓ Expanded liquidity cycle analysis
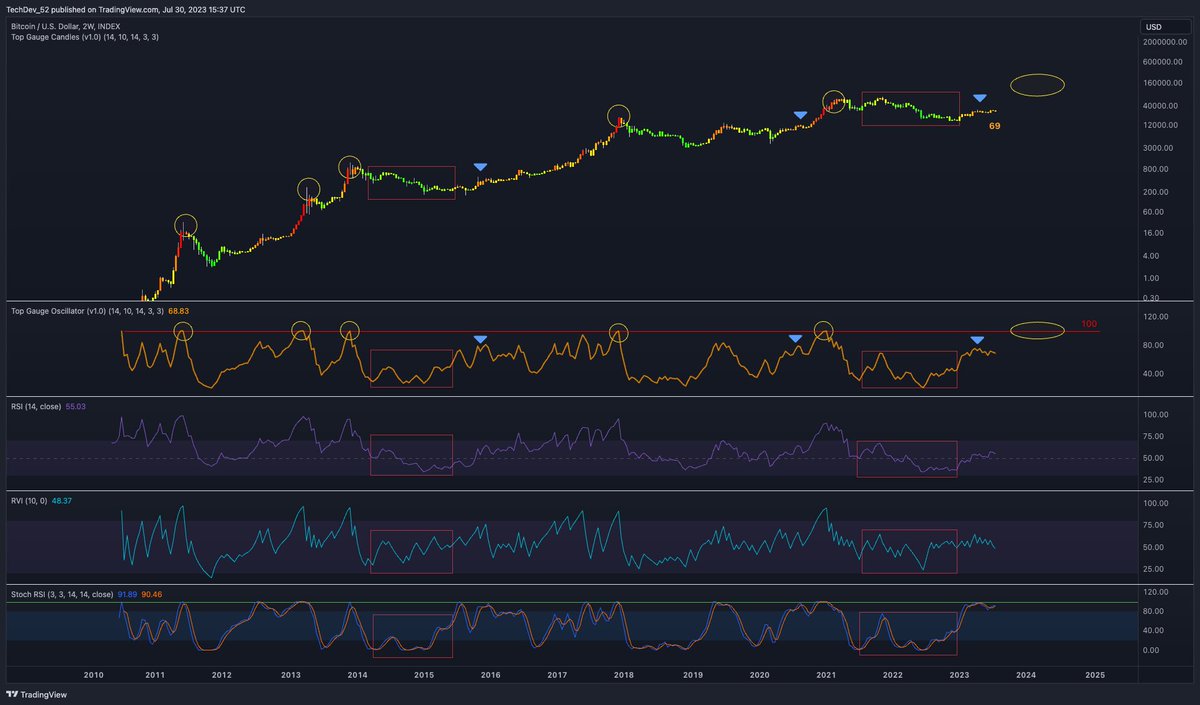
✓ 3 topping signals to watch
(1 with custom TV indicator, 2 with live chart links)
Free trial now available. Sub link in bio.
AAII Sentiment Survey:
*Optimism continues to be unusually low
*Neutral is below avg for just the 2nd time in ~18 weeks
*Pessimism is back at an unusually high level
(Unusually low optimism & high bearish has been happening a lot but it's not normal.)
https://t.co/CPRW7Qb6JE
Four days ago the #Bitcoin USD index closed its 2-month candle over the Bollinger band basis (20MA).
Third time since 2009.
The other two times?
Price went to the top band before a red 2-month candle.
Top band currently sits at 61K.
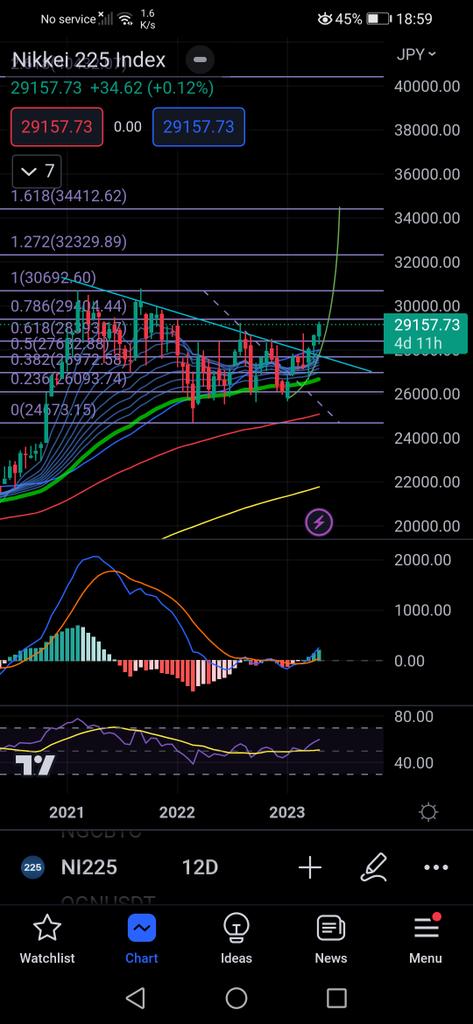
$NI 225 - 12 day chart. Clean break out from a multi-month consolidation and now proceeding for a blow off top. US markets won't remain behind for very long.
Hard for me to ignore the clear impact of the ~3.5 year liquidity cycle on #Bitcoin’s price.
While many are still looking to the next halving event as the starting signal for the major leg in #Bitcoin’s next rise, to me we saw this signal back in November, which indicated the start of the next liquidity cycle.
After each of these prior 5 signals, #Bitcoin has taken no more than 12 months to put in a major top. Though history is never a guarantee of future. Only a probabilistic guide.
This work has led me to conclude that the placement of the halving events and their apparent impact on price has likely been coincidental, as #Bitcoin began at the start of one of these liquidity cycles following the 2008 crisis.
Regardless, whether the next major top hits in 2023, 2024, or 2025, long term investors likely won’t complain.
This next move will be the first with a real chance to confirm or deny both theories, and is exciting to me from that standpoint.
“If I put $500 in $PEPE 3 weeks ago it’d be worth over $2M now.”
No.
If you put $500 in 3 weeks ago and watched it go to:
$5k $50k $100k $200k…
and did nothing
Then watched $200k go to $60k
and still did nothing
Then watched $60k go to $750k
and still did nothing
Then watched $750k go to $350k
and still did nothing
The watched $350k go to over $2M
and then for some reason decided to do something…
Then yes, $500 3 weeks ago would be worth over$2M now.