very basic
Step-by-Step Integration of Google OAuth2 with JWT Authentication and mongoose in Express Application
Github repo -> https://t.co/gzba1RqS6L
read https://t.co/RvRP3YTeSh for all steps
#100dayscode#codinglife
or follow this
thread
$NEAR has rallied roughly 85% in just 18 days.
Even more impressive, the last three daily candles have closed green, with gains of approximately:
📈 +8%
📈 +17%
📈 +20% (currently)
Momentum is clearly on the bulls' side.
The challenge?
Price is now testing a major resistance zone that previously acted as support throughout 2025.
This is where strong trends either accelerate or get rejected.
📊 Bullish Scenario:
A daily close above resistance could confirm a breakout and potentially trigger another leg higher.
📊 Bearish Scenario:
After an 85% rally, a rejection from resistance could lead to profit taking and a retest of lower support levels.
Momentum is strong.
Resistance is stronger.
The next few daily candles could decide who wins.
Would you chase the breakout or wait for a pullback?
🚨 BREAKING:
The Verus bridge exploiter has returned 4,052 $ETH to the team, representing 75% of the stolen funds.
The attacker kept 1,350 ETH as a bounty after accepting Verus settlement offer.
Would you call this a successful recovery?
$ZEC just tested one of the most important resistance zones on its chart.
After an explosive rally from the $200s to above $680, It reached the $685 resistance area and failed to secure a breakout.
Now the market faces two possibilities:
- Consolidation below resistance before another breakout attempt
- A deeper pullback toward the key $488 support zone
The bigger picture remains unchanged:
As long as ZEC holds support, the bullish structure remains intact.
The next few weeks could decide whether ZEC enters price discovery or enters a larger correction.
$ZEC is showing one of the strongest structures in the market right now.
After pumping nearly 100% from $320 to $636, Zcash corrected 25%, reclaimed support near $488 and immediately bounced back another 27%.
Now price is once again testing the descending resistance trendline.
While most of the market is struggling, ZEC continues pressing higher.
A breakout here could completely change the structure.
🚨 GitHub confirms thousands of internal repositories were accessed without authorization.
Binance founder CZ is now warning crypto developers to rotate API keys immediately even from private repos.
Crypto security threats are escalating fast.
$BTC is once again testing a rising support structure that has repeatedly decided market direction over the last year.
Every major breakdown from these ascending supports previously triggered aggressive downside expansions.
Now the key level is the purple demand zone near $72K.
If Bitcoin loses:
• the rising structure
• and the $72K demand zone
then probability of a deeper correction below $60K increases significantly.
This is one of the most important structures on the chart right now.
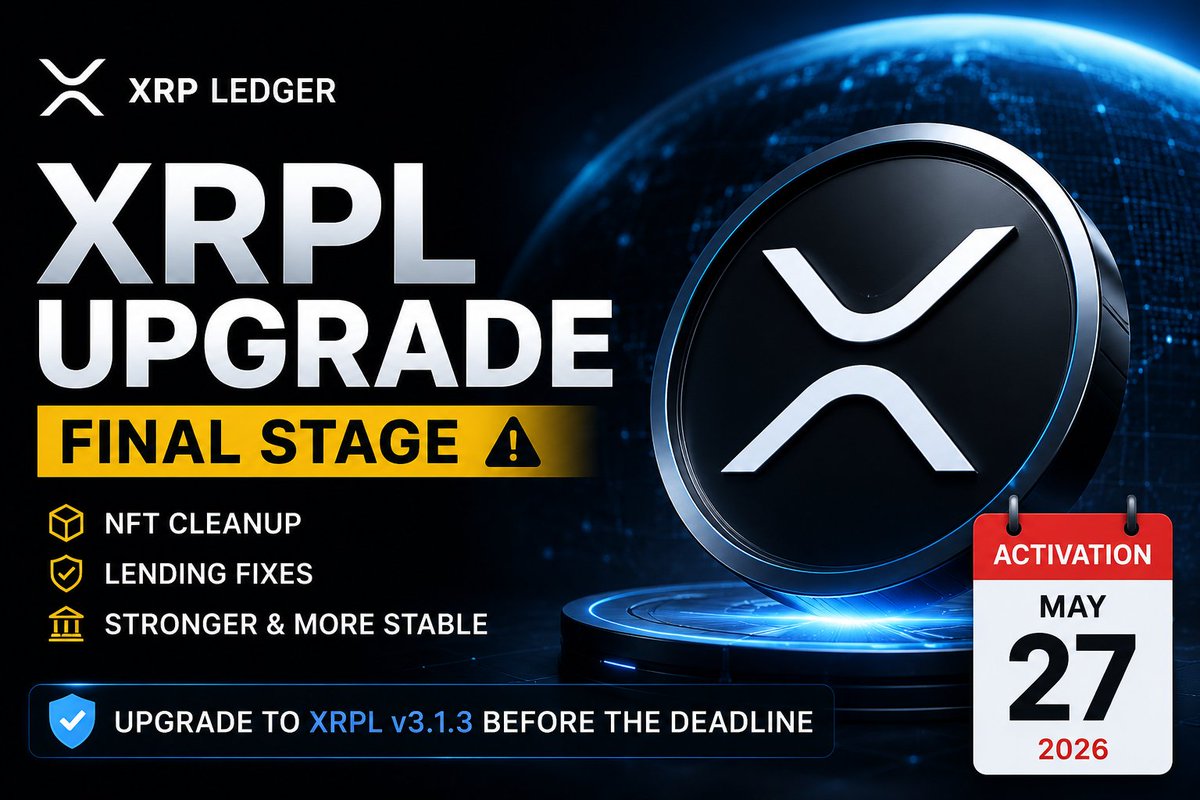
🚨 XRP Ledger’s FixCleanup3_1_3 upgrade goes live May 27.
Validators are being urged to upgrade to XRPL v3.1.3 before activation to avoid amendment blocking issues.
The update improves NFT cleanup, lending reliability, vault accounting, and permissioned domains.
Meanwhile, the community is now debating whether XRPL could temporarily split if validators fail to upgrade in time.
Big week ahead for $XRP
$INJ just reclaimed one of the most important structural levels on its chart.
After losing this support in January 2026, Injective spent months consolidating below it before finally flipping the zone back into support again.
What makes this level important:
INJ previously traded above it for nearly 3 years since April 2023.
At the same time, RSI is now above 70, showing strong momentum expansion across the chart.
Yes, technically RSI is entering overbought territory.
But during strong trend reversals, RSI can remain overheated while price continues pushing higher.
Right now, structure and momentum both remain bullish for $INJ.
$SUI rejected sharply from the recent $1.41 local top and is now trading nearly 27% below that high.
The most important level on the chart right now sits near $1.04.
As long as SUI continues holding this support region, market structure can stabilize again.
But if support breaks:
• next major demand zone sits near $0.87
• extending the correction toward nearly 38% from the recent high
Right now, support defense matters more than upside targets.
$SUI is slowly building one of the cleaner recovery structures on the chart right now.
The most important part of this setup:
price continues holding above the major purple demand zone despite months of market pressure.
As long as SUI remains above that support region, the broader structure stays constructive.
The first major resistance sits near $1.33.
If bulls reclaim that level successfully, the door opens for a potential 40-45% expansion from current prices.
For now, support remains in control while the market attempts recovery.
Interesting setup on $SUI.
Price is holding above accumulation support while slowly pushing toward the $1.33 resistance zone.
If that level breaks, momentum could shift very quickly across the entire structure.
$SUI is slowly building one of the cleaner recovery structures on the chart right now.
The most important part of this setup:
price continues holding above the major purple demand zone despite months of market pressure.
As long as SUI remains above that support region, the broader structure stays constructive.
The first major resistance sits near $1.33.
If bulls reclaim that level successfully, the door opens for a potential 40-45% expansion from current prices.
For now, support remains in control while the market attempts recovery.