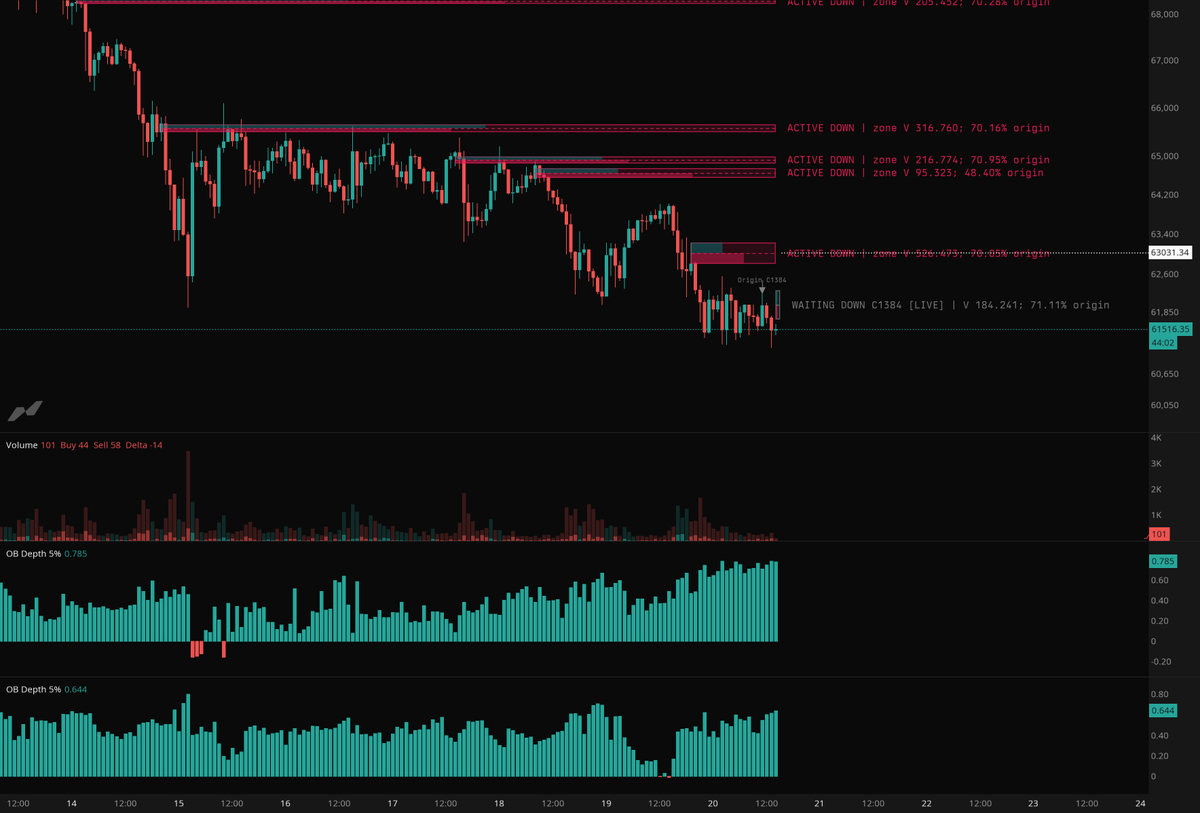
Around 1,450 BTC traded at $60K across Binance, Coinbase, and Kraken.
And the level still didn't hold. Price went through it like a hot knife through butter.
Now I'm curious. What exactly was the strategy behind all that buying 😶
Those buy walls at $60K on Binance and Coinbase looked like obvious spoofing.
609 BTC on Binance. 264 BTC on Coinbase.
But the orders actually got filled. So much for my spoofing theory 😶
@Darkfost_Coc I wouldn't rush to conclusions just yet. You're definitely not the only one affected, and this was pretty much expected.
@arkham did leave one door open, though - the Grants program. Might be worth checking out 😶
Crypto Sectors Are Bleeding, and Altcoins Are Following Bitcoin!
Over the past year, several crypto sectors have significantly underperformed BTC:
🔴 Layer 2: -70.1%
🔴 Gaming: -68.5%
🔴 Memecoins: -59.2%
🔴 AI: -55.6%
⚪ Bitcoin: -32.3%
Meanwhile, Alphractal's Correlation Heatmap reveals that most major altcoins remain strongly correlated with Bitcoin.
What does this mean?
📉 When Bitcoin falls, altcoins generally follow.
📈 When Bitcoin rises, altcoins also tend to move higher.
However, correlation doesn't mean equal performance. Some sectors experience significantly greater losses or gains than BTC.
Bitcoin continues to drive the broader crypto market, but not all sectors react with the same intensity.
Understanding these correlations and sector performance is essential for identifying market opportunities.
Explore both metrics on Alphractal.
https://t.co/sMbQlJMS4w
$62K was almost entirely absorbed. Now buy walls are sitting at $61K on both Bin & Coin
Meanwhile, market structure is anything but bullish
Someone keeps buying. But why?
Wouldn't it make more sense to see some real frustration among buyers before we get a meaningful bounce?
BTC swept the low into a wall of Hyperliquid stop losses, took $150M+ of sell delta, and held LTF.
You could see the stops sitting there before price got to them, with MMT Pro.
Pro also gives you:
- Hyperliquid take profit and liquidation maps, built from real on-chain positions
- HD order book heatmaps, where Free streams SD
- Hyperliquid Footprint Pro modes
- the liquidation heatmap, levels from 5x to 100x leverage plotted on price
- sub-minute charts, with 5,000 bars of history
- native TPO charts
- 25,000 bars of chart history, up from 2,500
- bar replay
Room for a full desk: 50 charts, 50 widgets, 20 alerts, 20 saved workspaces and 5 custom timeframes.
Pro is $29/mo for Black Friday, locked monthly for life, until Mon 30th November. Best time to try it.