If you invested $10,000 in All Weather a decade ago, you would have turned that $10,000 into about $15,200. That was 4.3% a year, and the ugliest stretch was a 24% drawdown.
Analysts do not expect a rebound. They expect more of the same.
You still get a mix built so one economic season does not own the whole account: 30% US stocks, 40% long-term Treasuries, 15% intermediate Treasuries, 7.5% commodities, 7.5% gold. Rebalance once a year and otherwise ignore it.
Vanguard's June 2026 outlook has this mix near 4.9% a year (4.3–5.6%), which is about $16,200 on the same $10,000. J.P. Morgan's 2026 numbers are a little higher at 5.2%, or about $16,600.
Owning it is still good for the person who wants to weather every season more than they want max growth, but don't plan on a quiet ride just because the name says All Weather.
If you invested $10,000 in a 60/40 a decade ago, you would have turned that $10,000 into about $21,800. That was 8.1% a year, and the ugliest stretch was a 17% drawdown.
Analysts do not expect a repeat.
You still get crash protection from the 40% in US bonds next to 60% US stocks. A bad year in stocks does not take the whole account with it. Rebalance once a year and otherwise ignore it.
Vanguard's June 2026 outlook has this mix near 5.0% a year (4.2–5.8%), which is about $16,400 on the same $10,000. J.P. Morgan's 2026 numbers are a little less grim at 5.9%, or about $17,700.
Owning it is still good for the person who will actually hold through a stock crash, but don't plan on receiving the same 8.1% returns.
Let's say you owned 1 share of SCHD at $60.
A $10 dividend paid out by an enterprise worth $60 brings its value down to $50. After you pay a 15% qualified-dividend tax on the $10, you have $8.50 and a $50 share of SCHD.
I would be emotional too.
The plan starts with $1M in spendable cash. Almost nobody has that.
Only about 18% of households even have $1M of total net worth, and that counts the house (Fed SCF). About 5% have $1M in a retirement account, which you cannot use for rent before 59 1/2 without tax and penalty consequences. Under 35, the median is $39k, and much of that is already locked up.
People are not skipping this. They cannot start it.
Log scale is the point. A doubling in 1980 is the same height as a doubling now.
1980 was the one that wrecked people. Gold printed $850. Volcker hiked. It was cut in half within two years, and it did not beat that peak, inflation-adjusted, until April 2025. Silver went from $50 to under $5.
2011 was a smaller version of the same movie. Gold fell from $1,921 to $1,050 by 2015, down 45%. Silver fell from $49 to $14, down 72%. Then it just sat there.
This cycle: gold about $5,600 in January, now around $4,400. Silver about $115, now around $63. Same shape. Earlier inning.
China is buying. That part is true. Official reserves at the People's Bank are 2,366 tonnes after 21 months of purchases. July was 20 tonnes, the biggest month since late 2023. Gold is still only 8% of China's foreign-exchange pile. The US sits on 8,133 tonnes and has for decades.
The version on your feed is 30,000 hidden tonnes. Banks that add up imports and mine output get a smaller story: more than Beijing reports, not more than Fort Knox. SocGen's 2025 gap was 250 tonnes bought versus 25 tonnes disclosed.
A little gold still has a job. It is insurance, not a business. No earnings to miss. No board to blow it up. When stocks and bonds are both having a political or currency problem, it is the piece that is not someone else's promise.
That is not a reason to buy the spike and wait for the moon. The move already happened. The last two times this movie ended, the expensive part was the years after the peak, not the peak itself.
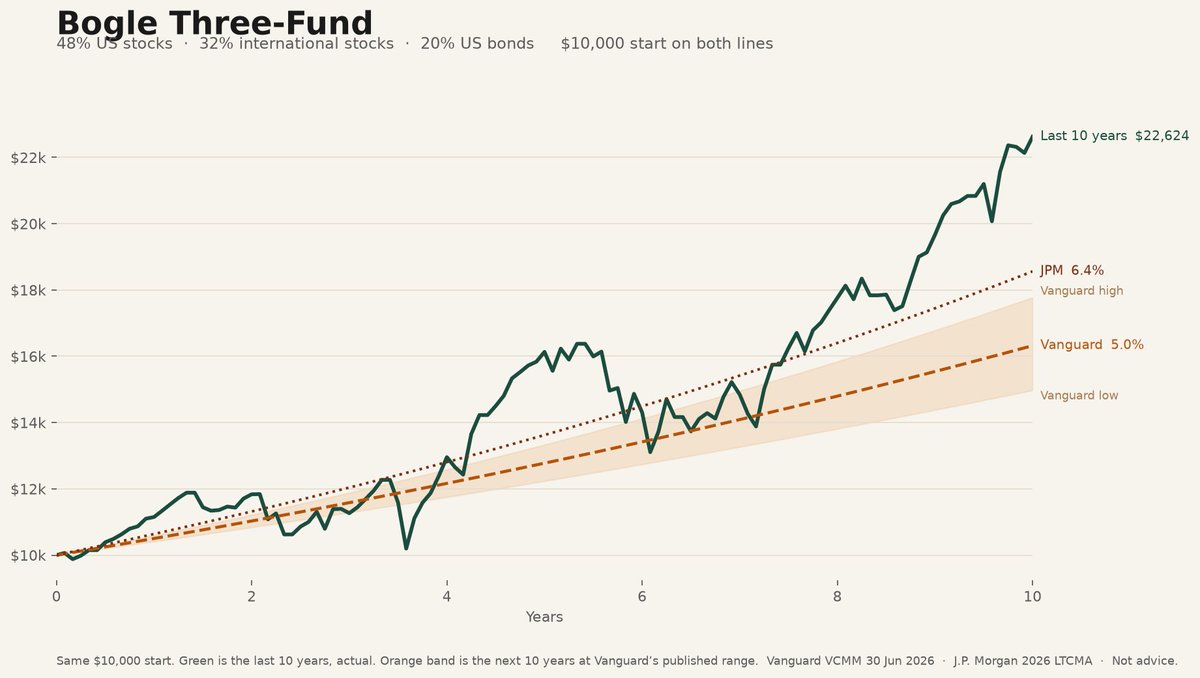
This is the default boring portfolio. Own the US stock market, own the rest of the world's stocks, keep a slice in US bonds, and leave it alone.
48% US total stock market
32% international stocks
20% US bonds
$10,000. Buy and hold. Rebalanced once a year.
Over the last 10 years it returned 8.5% a year. Volatility was 11.9%. The worst drop was about 20%. That $10,000 became $22,600.
The next 10 years are priced colder. Vanguard's June 2026 model puts this mix at about 5.0% a year (4.1–5.9%), or roughly $16,300. J.P. Morgan's 2026 assumptions are a bit higher at 6.4%, or about $18,600.
Owning it is still good for the investor who wants one simple plan and will leave it alone, but don't plan on receiving the same 8.5% returns.
@moinvests28 Correct. You also don't do it twice. The 38x screenshot never includes the ten accounts that went to zero. An index fund is what you own after you admit you can't pick the screenshot.
@DevotedDividend VOO already owns most of what QQQ owns. QQQI and SPYI sell the upside that creates the wealth. That's not a simple mix of growth and income. It's three wrappers on the same seven stocks with a call written against them.
@YodaStockInvest Concentration is how some people got rich and how most people blew up. Bessembinder: 4% of US stocks created all the net wealth above T-bills since 1926. One-to-four names is a lottery ticket, not a plan.
@TheLongInvest The $64k only exists if the yield holds and the stock stops falling. That 6.4% yield is high because the price already got crushed, and the dividend has been stuck at $0.43. Yield is the market pricing low growth. Total return is the number that matters.
@dollarsanddata This doesn’t prove owning your time is a myth. It proves high earners chose longer hours. A nurse on nights doesn’t “own” less time because a lawyer bills 70. The surplus is what buys the calendar back, not the clock.
@Brian_Stoffel_ Respect that you score your calls publicly. Most don't. S&P's SPIVA data shows ~88% of US large-cap funds trailed the index over 15 years, and fees explain a big slice of that gap. Keeping a scoreboard is the only way to know which side of it you're on.
@InvestInAssets Worth pairing with Bessembinder's data: from 1926-2016 the median US stock underperformed one-month T-bills, and just 4% of listed firms generated all the net wealth above bills. The index compounds; the average individual stock doesn't. Own the whole chart.
@BrianFeroldi The hard part is "hold." Morningstar's Mind the Gap study keeps finding the average fund investor earns about 1 point a year less than the funds they own, purely from buying and selling at the wrong times. The strategy isn't what fails, we are.